 E-submission
Articles
- Page Path
- HOME > Ann Clin Nutr Metab > Volume 17(1); 2025 > Article
- Original Article Effects of enteral nutrition formulas with varying carbohydrate amounts on glycemic control in diabetic mice
-
Yukari Miki
 , Kazuo Hino
 -
Annals of Clinical Nutrition and Metabolism 2025;17(1):85-93.
DOI: https://doi.org/10.15747/ACNM.25.0006
Published online: April 1, 2025
Medical Foods Research Institute, OS-1 Division, Otsuka Pharmaceutical Factory, Inc., Naruto, Japan
- Corresponding author: Yukari Miki email: Miki.Yukari@otsuka.jp
This article is a secondary publication of the article in Japanese published in the
• Received: February 4, 2025 • Revised: March 1, 2025 • Accepted: March 13, 2025
© 2025 Korean Society of Surgical Metabolism and Nutrition · Korean Society for Parenteral and Enteral Nutrition · Asian Society of Surgical Metabolism and Nutrition · Japanese Society for Surgical Metabolism and Nutrition
This is an Open Access article distributed under the terms of the Creative Commons Attribution Non-Commercial License (http://creativecommons.org/licenses/by-nc/4.0), which permits unrestricted non-commercial use, distribution, and reproduction in any medium, provided the original work is properly cited.
- 140 Views
- 12 Download
Abstract
-
Purpose This study evaluated the effects of an 8‑week liquid diets with different carbohydrate contents–64% energy in HINE E‑Gel (ST) and 50% energy in HINE E‑Gel LC (LC)–on glycemic control and nutritional status in a mouse model of type 2 diabetes mellitus (db/db mice). The objective was to determine whether reducing carbohydrate intake within the Dietary Reference Intakes for Japanese people improves glycemic control indices, addressing the evidence gap in regarding the long‑term safety and efficacy of low‑carbohydrate enteral nutrition in patients with diabetes.
-
Methods db/db mice (n=10 per group) and non‑diabetic db/m mice (n=4) as controls were fed ST, LC, or AIN‑93G diets ad libitum for 8 weeks. The diets primarily differed in carbohydrate content (64% in ST vs. 50% in LC). Blood glucose and glycated hemoglobin (HbA1c), plasma glucose and glycoalbumin, organ weights, and renal function markers were measured weekly or at 4 and 8 weeks. Histopathological examinations of the liver and kidneys were performed at 8 weeks.
-
Results At 8 weeks, the LC group showed significantly lower plasma glucose (P=0.0051) and glycoalbumin (P=0.0013) levels compared to the ST group, with a trend toward lower HbA1c (P=0.0514). Although body weight was significantly higher in the LC group (P=0.0038), there were no significant differences between the ST and LC groups in caloric intake, renal function, or histopathological findings.
-
Conclusion Reducing carbohydrate intake to 50% of total energy within dietary guidelines may improve glycemic control in diabetic mice, suggesting the need for further long‑term evaluation for clinical applications.
Introduction
In nutritional management utilizing enteral nutrition formulas, products with reduced carbohydrate content compared to the standard range (45%–60% energy) may be employed as needed to attenuate post‑administration blood glucose spikes [1]. Enteral nutrition products with a lower carbohydrate content (32.4% energy) have been reported to mitigate blood glucose elevations and reduce insulin usage in critically ill patients receiving early enteral nutritional management [2], as well as improve glycemic control in perioperative enteral nutrition patients [3].
The Dietary Reference Intakes for Japanese 2020 were established for healthy individuals and populations, with a target carbohydrate level of 50%–65% energy [4]. Accordingly, standard enteral nutrition products are formulated to meet this target for long‑term nutritional management. However, insufficient evidence supports the prognosis and safety of long‑term use of enteral nutrition products containing carbohydrates below this target [5]. Moreover, a meta‑analysis comparing low‑carbohydrate and low‑fat diets on cardiovascular risk factors found that low‑carbohydrate diets resulted in weight loss and triglyceride reduction, while low-density lipoprotein cholesterol levels increased [6].
A consensus statement by the Japan Diabetes Society indicates that no definitive evidence exists for an optimal energy‑producing nutrient ratio for the prevention and management of diabetes; thus, individualized and flexible approaches are recommended. As a general guideline, however, carbohydrate energy should comprise 50%–60% (150 g/day or more), protein should account for 20% or less, and the remaining energy should be derived from lipids. If the fat energy ratio exceeds 25%, it becomes crucial to consider the fatty acid composition and adjust by increasing the proportion of polyunsaturated fats [7].
Because prolonged hyperglycemia can lead to various forms of organ damage [8], effective glycemic control is paramount. Consequently, it is important to investigate the effects of long‑term administration of standard enteral nutrition formulas in patients requiring stringent glycemic control.
This study investigated the effects of an 8‑week administration of enteral nutrition formulas, with varying carbohydrate amounts within the target range of the Dietary Reference Intakes for Japanese people, on glycemic control indices and nutritional status in a mouse model of type 2 diabetes mellitus. The test diets were HINE E‑Gel (ST) and HINE E‑Gel LC (LC), containing 64% and 50% carbohydrate energy, respectively, while being similar in overall composition. A preliminary study (unpublished) in normal animals indicated that a single oral administration of LC produced a significantly lower early‑phase increase in blood glucose levels compared to ST.
Methods
This study was conducted in accordance with the animal experiment guidelines of Otsuka Pharmaceutical Factory, Inc. and was approved by the Otsuka Pharmaceutical Factory Animal Experiment Committee (approval number: OPFCAE‑20‑143).
The test diets used were HINE E‑Gel (ST) and HINE E‑Gel LC (LC), which contain 64% and 50% carbohydrate energy, respectively, while being similar in overall composition except for carbohydrate content. Both ST and LC were lyophilized and provided to the animals as powdered diets. For comparison, a standard purified feed, AIN‑93G (Oriental Yeast Co., Ltd.), was also used. AIN‑93G has an energy ratio of 19.3% protein, 16.7% fat, and 64.0% carbohydrate [9]. In contrast, ST contained 16.0% protein, 19.8% fat, and 64.3% carbohydrate, while LC contained 16.0% protein, 34.0% fat, and 50.0% carbohydrate. The detailed nutrient composition of ST, LC, and AIN‑93G [9] is presented in Table 1.
Six-week-old male BKS.Cg-+ Lepr db/+ Lepr db/Jcl mice (db/db mice) (CLEA Japan, Inc.) were used as experimental animals. db/db mice are commonly used as model animals for type 2 diabetes mellitus because they spontaneously develop symptoms of diabetes, such as obesity, overeating, and hyperinsulinemia [10]. BKS.Cg-m+/+Lepr db/Jcl mice (db/m mice) (CLEA Japan, Inc.), which are closely related to db/db mice but do not develop diabetes, were served as control animals. The mice were maintained at a temperature of 23±3 °C, 55%±15% humidity, and a 12‑hour light‑dark cycle (light period: 07:00–19:00). During the acclimation period, the mice were fed AIN‑93G.
After 12 days of acclimation, the 8‑week‑old db/db mice were fasted overnight, and glucose was administered orally at 1.0 g/kg body weight. Tail‑vein blood glucose levels were measured immediately before administration and at 15, 30, 60, and 90 minutes post‑administration using a glucose analyzer (Glutest Mint, Sanwa Kagaku Kenkyusho Co., Ltd.). The area under the curve (AUC) for blood glucose levels was calculated with time on the horizontal axis and blood glucose on the vertical axis. Based on the AUC values, mice were assigned to three groups via stratified randomization using the equal‑width method with the statistical analysis software EXSUS Ver. 10 (EP Croit Co., Ltd.): db/db mice fed AIN‑93G (DM group, n=4), db/db mice fed the test diet ST (ST group, n=10), and db/db mice fed the test diet LC (LC group, n=10). The grouping results are presented in Table 2 and 3.
There were no significant differences between groups, confirming that stratified randomization was effective. Similarly aged db/m mice were fed AIN‑93G as the CT group (n=4). All animals were provided with the prescribed test diet and water ad libitum for 8 weeks. Food intake was measured before administration and at 4 and 8 weeks after administration. Boby weight and tail‑vein blood glucose levels were measured weekly during the study period. Tail‑vein blood and 24‑hour urine samples were collected before administration and at 4 and 8 weeks after administration. Following the 8‑week collection, the animals were sacrificed by exsanguination after blood collection from the posterior vena cava under isoflurane anesthesia, and necropsy was performed. Tissues including the liver, kidneys, lower limb skeletal muscles, and epididymal fat were collected.
At baseline, 4, and 8 weeks after administration, a small incision was made in the tail vein with a scalpel, and the exuded blood was used to determine blood glucose levels. The remaining blood was collected into heparin‑filled microcentrifuge tubes for glycated hemoglobin (HbA1c) measurement (DCA Vantage, Siemens Healthcare Diagnostics Inc.). Plasma was separated from the necropsy blood. All plasma and urine samples were stored at –80 °C until analysis. Plasma glucose, glycoalbumin, urea nitrogen, total protein, albumin, total cholesterol, triglycerides, as well as urinary albumin and N‑acetylglucosaminidase, were measured using an automatic analyzer 7180 (Hitachi High‑Tech Corporation).
Tissue samples were weighed using a precision balance, and the liver and kidneys were fixed in a 10% neutral buffered formalin solution (pH 7.4). The hematoxylin‑ and eosin‑stained liver and kidney specimens were subsequently examined pathologically. Note that one kidney specimen from the LC group was missing due to technical issues. Hepatocyte lipidosis, glomerulonephritis, and mesangial cell proliferation were graded as “very slight” when 0%–25% of the evaluation area was affected, and as “slight” when 25%–50% was affected.
Data are presented as the mean±standard deviation. Repeated measures analysis of variance was employed to compare blood glucose, HbA1c, and body weight at different time points between the ST and LC groups, with group and time point as the two factors. Fisher test was used to analyze histopathological differences in incidence, while the Wilcoxon rank‑sum test (a non‑parametric test) was used for other comparisons. The CT and DM groups were served as reference groups. A significance level of 5% was used. Statistical analyses were performed using EXSUS Ver. 10 (EP Croit Co., Ltd.) and Bell Curve Ver. 4.00 (Social Survey Research Information Co., Ltd.) for histopathological examinations.
Results
There were no significant differences in daily caloric intake between the ST and LC groups at baseline, 4 weeks, or 8 weeks after administration (Table 4). However, body weight was significantly higher in the LC group compared to the ST group (P=0.0038) (Fig. 1). When organ weights were normalized to body weight, differences were observed between the ST and LC groups in the liver and tibialis anterior muscles, but not in the epididymal fat, kidneys, gastrocnemius, or soleus muscles (Table 5).
At 8 weeks, plasma glucose and glycoalbumin levels were significantly lower in the LC group than in the ST group (P=0.0051 and P=0.0013, respectively) (Table 6). Although HbA1c tended to be lower in the LC group than in the ST group (P=0.0514), no differences in overall blood glucose levels were observed between the two groups (Fig. 2).
Urinary albumin and N‑acetylglucosaminidase levels showed no significant differences between the ST and LC groups at 8 weeks after administration (Table 7).
At 8 weeks, no significant differences were observed between the ST and LC groups in total protein, albumin, or triglycerides. However, blood urea nitrogen was significantly higher in the ST group than in the LC group (P=0.0058), and total cholesterol was significantly higher in the LC group than in the ST group (P=0.0125) (Table 8).
In the liver, lobular‑centered, very slight hepatocyte lipidosis was observed in all four mice in the DM group, in nine of 10 mice in the ST group, and in seven of 10 mice in the LC group; additionally, slight lipidosis was observed in three of 10 mice in the LC group. Very slight glomerulonephritis and mesangial cell proliferation in the kidneys were observed in two of four mice in the DM group, three of 10 mice in the ST group, and three of nine mice in the LC group. The incidences of hepatocyte lipidosis, as well as very slight glomerulonephritis and mesangial cell proliferation in the kidneys, did not differ significantly between the ST and LC groups.
Discussion
The comparison between the CT and DM groups, established to confirm that the groups accurately represent the disease state of diabetes mellitus, demonstrated that the DM group consistently exhibited higher blood glucose and HbA1c levels than the CT group throughout the evaluation period, confirming the onset of diabetes mellitus. There was no significant difference in caloric intake between the ST and LC groups at any time point (before administration and at 4 and 8 weeks post-administration). Similarly, no significant differences in blood glucose levels were observed between the ST and LC groups at these time points; however, HbA1c tended to be lower in the LC group (P=0.0514). Glycoalbumin—a potentially more useful marker than HbA1c for assessing whether blood glucose levels remain within a target range, as it reflects variations in postprandial blood glucose in addition to mean levels [11]—was significantly lower in the LC group than in the ST group at 8 weeks post-administration. Plasma glucose was also significantly lower in the LC group. In our preliminary study comparing blood glucose levels in normal animals after a single oral administration of ST and LC, blood glucose levels were significantly lower in the LC group than in the ST group during the early phase of administration (unpublished). In this study, blood glucose levels were measured at fixed intervals after feeding, suggesting that variations in the degree of blood glucose elevation during feeding accumulated over time and were reflected in the differences observed in HbA1c and glycoalbumin levels.
A study using diabetic mice observed differences in HbA1c after feeding diabetic model mice (Akita mice) diets with widely varying carbohydrate contents (68% vs. 16% energy ratio) for 8 weeks [12]. Furthermore, STZ-induced diabetic model mice were fed diets with carbohydrate energy ratios of 75, 20, 15, and 1% for 14 weeks. Lower carbohydrate energy ratios were associated with reduced postprandial blood glucose levels, and the glucose AUC during the glucose tolerance test was also lower. Additionally, significant differences were noted between the groups with the lower carbohydrate energy ratios (20% and 15%) [13]. In a human study, it was reported that over 14 days, diets with widely different carbohydrate contents (approximately 10% vs. 75% energy) resulted in higher blood glucose levels and poorer glucose tolerance in the high-carbohydrate group [14]. Thus, the difference in carbohydrate energy ratio between ST and LC (64% vs. 50%) in this study may have affected glucose tolerance, leading to the observed differences in plasma glucose and glycoalbumin levels.
The present results suggest that even a modest difference in carbohydrate content in enteral nutrition formulas, such as a 64% versus 50% energy ratio, can produce measurable differences in plasma glucose and glycoalbumin, which are key indicators of glucose control, after a period of management. Recently, cases of ketoacidosis have been reported in patients who are on extremely low-carbohydrate diets and are taking SGLT2 inhibitors [15]. We hypothesize that reducing carbohydrate intake within the dietary reference intakes could be beneficial for preventing ketoacidosis and controlling blood glucose in these patients.
Long-term nutritional management requires attention not only to glycemic control indices but also to other nutritional parameters. Plasma total protein and albumin, which are standard nutritional indices, did not differ between the ST and LC groups, suggesting that whole-body protein metabolism was similar in both groups. The body weight of the LC group was significantly higher than that of the ST group, despite similar daily caloric intakes between the two groups at all time points (before, 4 weeks, and 8 weeks post-administration). When normalized to body weight, organ weights showed no differences in epididymal fat and lower limb skeletal muscle, except for the tibialis anterior muscle, between the ST and LC groups. Body weight is maintained when caloric intake equals caloric expenditure. Although the ST and LC groups had similar caloric intakes, carbohydrates require more energy for diet-induced thermogenesis compared to fats. This may explain why the LC group, with its lower carbohydrate intake, exhibited a higher body weight than the ST group. However, this difference in body weight may not have been sufficient to produce differences in organ weights normalized to body weight. Body weight and composition are as critical as blood glucose levels in managing diabetes mellitus; therefore, future studies should examine changes in these parameters in detail.
In this study, differences in carbohydrate content among the test diets were balanced by adjusting the fat content; thus, the effects of fat intake must be considered in long-term management. Liver histopathology revealed no evidence of accelerated hepatocyte lipogenesis in the LC group, suggesting that the impact of increased fat content on liver fat accumulation was minimal. Liver weight normalized to body weight was significantly higher in the ST group than in the LC group, likely attributable to weight loss in the ST group. Plasma total cholesterol levels were significantly higher in the LC group compared to the ST group; however, these levels were similar to those in the DM group, and no differences in triglyceride levels were observed between the two groups. In the LC group, the fat content was primarily composed of medium-chain fatty acids and monounsaturated fatty acids. Since monounsaturated fatty acids are known to improve lipid metabolism [16], the impact of fat content on these parameters is likely minor.
Since hyperglycemia can damage various organs [8], renal function was evaluated, and renal histopathological examinations were performed. The mouse models of diabetes mellitus used in this study exhibit pathologies similar to progressive diabetic kidney disease, including increased urinary albumin and mesangial substrate [10], paralleling human pathology, where urinary albumin excretion further increases as the disease progresses [17]. The DM group, serving as the reference, was used to evaluate both renal function and histopathological changes. As expected, the DM reference group exhibited significantly higher levels of urinary albumin and N-acetylglucosaminidase compared to the ST and LC groups. The low urinary albumin levels in the ST and LC groups suggest a milder disease progression. Because restricted feeding is known to improve renal parameters [18], the reduced caloric intake or variations in the composition of the test diets likely contributed to mitigating the symptoms. The LC group exhibited urinary albumin and N-acetylglucosaminidase levels comparable to those of the ST group. Moreover, no significant differences were observed in renal histopathology between the ST and LC groups, suggesting that the test diets exerted a similar impact on the kidneys. However, the long-term progression of diabetic nephropathy remains unclear and warrants further investigation. The protein sources for the test diets were soybean peptide and collagen peptide in the ST and LC groups, and casein (AIN-93G) in the DM group. Soybean peptide has been reported to improve glucose metabolism by increasing GLUT4 expression in skeletal muscle more effectively than casein [19]. Additionally, one report suggests that protein quality is more critical than quantity in preserving renal function, noting a reduced risk of end-stage renal failure when the protein source was switched to soy [20]. Therefore, it is important to consider both carbohydrate content and protein source when evaluating the effects of diet on glycemic control and renal function in diabetes mellitus.
The limitations of this study include the 8-week evaluation period and the potential effects of the test diets on caloric intake. For applications beyond the study period, careful administration is necessary, and a longer-term evaluation is required to clarify the effects on glycemic control, nutritional status, and renal disorders. Further studies involving both young and aged animals, which are not pathological models, are necessary for clinical translation. ST and LC are enteral nutrition formulas developed for humans; in this study, they were powdered and used as test foods. Consequently, it is possible that mice disliked the taste and odor of these test diets, which may have affected caloric intake during ad libitum feeding. Since no differences in caloric intake were observed between the ST and LC groups at any time point (before, 4 weeks, and 8 weeks post-administration), comparisons between the two groups are considered valid. However, for a more rigorous nutritional assessment, equalizing the caloric intake between the three groups (DM, ST, LC) is necessary in a mouse model of type 2 diabetes mellitus.
This study demonstrated that reducing carbohydrate intake within the range of the Dietary Reference Intakes for Japanese people may lower plasma glucose and glycoalbumin levels—key indices of glycemic control—in diabetic mice. Further long-term evaluations are needed.
Authors’ contribution
Conceptualization: KH. Methodology: YM, KH. Formal analysis/validation: YM, KH. Project administration: KH. Funding acquisition: Not applicable. Writing – original draft: YM. Writing – review and editing: YM, KH. All authors read and approved the final manuscript.
Conflict of interest
YM and KH are employees of Otsuka Pharmaceutical Factory, Inc. Except for that, no potential conflict of interest relevant to this article was reported.
Funding
None.
Data availability
Research data are available from the corresponding author upon reasonable request.
Acknowledgments
None.
Supplementary materials
None.
Fig. 1.
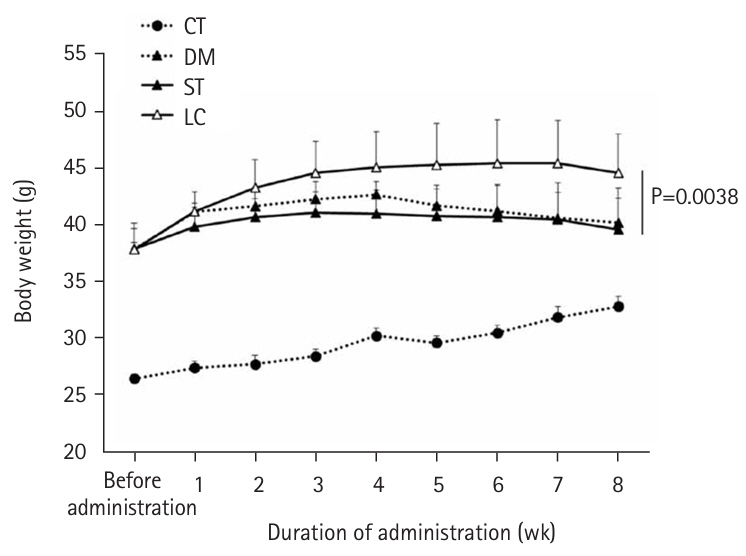
Weight transition. Vales are presented as mean±standard deviation; ST versus LC (repeated measurement variance analysis). CT group, control group; DM group, db/db mice fed AIN‑93G; ST group, db/db mice fed the test diet ST (HINE E-Gel); LC group, db/db mice fed the test diet LC (HINE E-Gel LC).
Fig. 2.
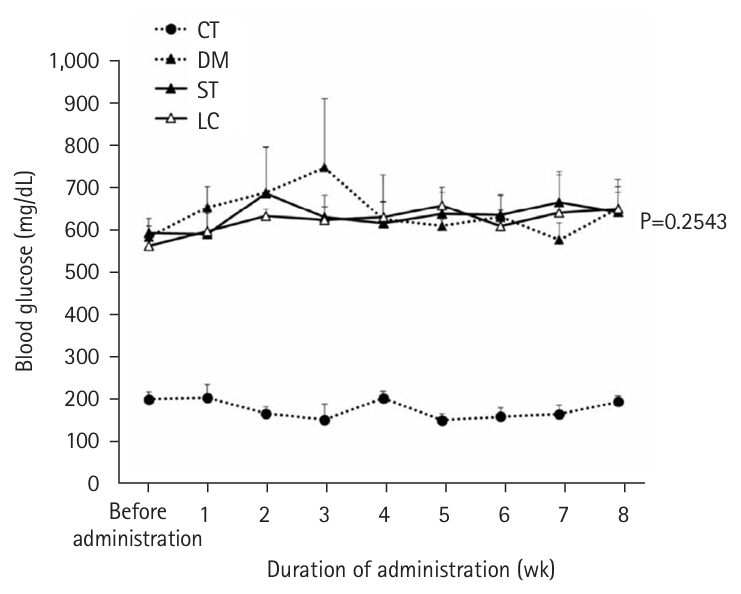
Changes in blood sugar levels from time to time. Vales are presented as mean±standard deviation. CT group, control group; DM group, db/db mice fed AIN‑93G; ST group, db/db mice fed the test diet ST (HINE E-Gel); LC group, db/db mice fed the test diet LC (HINE E-Gel LC).
Table 1.
Nutritional components of test foods
Table 2.
Grouping based on AUC
| Groupa | AUC mean | SD | SE | Median |
|---|---|---|---|---|
| DM (mg·min/dL) (n=4) | 52,170 | 4,887 | 2,444 | 53,505 |
| ST (mg·min/dL) (n=10) | 52,289 | 5,441 | 1,721 | 52,395 |
| LC (mg·min/dL) (n=10) | 52,099 | 6,036 | 1,909 | 52,384 |
Table 3.
Tukey-type multiple comparison test of AUC
| Reference groupa | Comparison group | t-statistic | P-value | Significance |
|---|---|---|---|---|
| DM | ST | 0.0358 | 0.9993 | NS |
| DM | LC | –0.0214 | 0.9997 | NS |
| ST | LC | –0.0756 | 0.9969 | NS |
Table 4.
Daily calorie intake
Table 5.
Tissue weights at 8 weeks after administration
Table 6.
Blood glucose control indicators
Values are presented as mean±standard deviation.
CT group, control group; DM group, db/db mice fed AIN‑93G; ST group, db/db mice fed the test diet ST (HINE E-Gel); LC group, db/db mice fed the test diet LC (HINE E-Gel LC); HbA1c, glycated hemoglobin.
ST versus LC (Wilcoxon two-group comparison test).
Table 7.
Renal function tests
Values are presented as mean±standard deviation.
CT group, control group; DM group, db/db mice fed AIN‑93G; ST group, db/db mice fed the test diet ST (HINE E-Gel); LC group, db/db mice fed the test diet LC (HINE E-Gel LC); U-ALB, urinary albumin; U-NAG, urinary N-acetylglucosaminidase.
ST versus LC (Wilcoxon two-group comparison test).
Table 8.
Blood biochemistry tests (after 8 weeks of administration)
- 1. Davidson P, Kwiatkowski CA, Wien M. Management of hyperglycemia and enteral nutrition in the hospitalized patient. Nutr Clin Pract 2015;30:652-9. ArticlePubMedPDF
- 2. Mori T, Matsuda H, Kubo N, Inadome N, Nakamori Y, Fujimi S. The effect on glycemic control of a low-carbohydrate, high-fat enteral formula in critically ill patients admitted to a trauma and critical care center. J Jpn Assoc Emerg Med 2011;22:871-7. Article
- 3. Kurita H, Kojima Y, Fujimori S, Nakatsuka A, Kobayashi H, Kurashina K, et al. The efficacy of fat and carbohydrate-adjusted nutritional food (Glucerna®) in perioperative blood glucose management. J Jpn Soc Intraven Enter Nutr 2023;18:45-50.
- 4. Ministry of Health, Labour and Welfare. Dietary Intakes for Japanese (2020 version), Report of the Study Group for Establishment of Dietary Intakes for Japanese. Ministry of Health, Labour and Welfare; 2020.
- 5. Uonaga T, Nogami T. How to use nutritional supplements based on case studies. Mon Pharm Aff 2021;63:1606-11.
- 6. Mansoor N, Vinknes KJ, Veierod MB, Retterstol K. Effects of low-carbohydrate diets v. low-fat diets on body weight and cardiovascular risk factors: a meta-analysis of randomised controlled trials. Br J Nutr 2016;115:466-79. ArticlePubMed
- 7. Yamauchi T, Kamiya H, Utsunomiya K, Watada H, Kawanami D, Sato J, et al. Medical nutrition therapy and dietary counseling for patients with diabetes-energy, carbohydrates, protein intake and dietary counseling. J Jpn Diabetes Soc 2020;63:91-109. ArticlePubMedPMCPDF
- 8. Giri B, Dey S, Das T, Sarkar M, Banerjee J, Dash SK. Chronic hyperglycemia mediated physiological alteration and metabolic distortion leads to organ dysfunction, infection, cancer progression and other pathophysiological consequences: an update on glucose toxicity. Biomed Pharmacother 2018;107:306-28. ArticlePubMed
- 9. Reeves PG, Nielsen FH, Fahey GC Jr. AIN-93 purified diets for laboratory rodents: final report of the American Institute of Nutrition Ad Hoc Writing Committee on the Reformulation of the AIN-76A Rodent Diet. J Nutr 1993;123:1939-51. ArticlePubMed
- 10. Sharma K, McCue P, Dunn SR. Diabetic kidney disease in the db/db mouse. Am J Physiol Renal Physiol 2003;284:F1138-44. ArticlePubMed
- 11. Koga M. Glycated albumin; clinical usefulness. Clin Chim Acta 2014;433:96-104. ArticlePubMed
- 12. Fujita Y, Atageldiyeva KK, Takeda Y, Yanagimachi T, Makino Y, Haneda M. A low-carbohydrate diet improves glucose metabolism in lean insulinopenic akita mice along with sodium-glucose cotransporter 2 inhibitor. Front Endocrinol (Lausanne) 2020;11:601594.ArticlePubMedPMC
- 13. Yang Z, Mi J, Wang Y, Xue L, Liu J, Fan M, et al. Effects of low-carbohydrate diet and ketogenic diet on glucose and lipid metabolism in type 2 diabetic mice. Nutrition 2021;89:111230.ArticlePubMed
- 14. Hall KD, Guo J, Courville AB, Boring J, Brychta R, Chen KY, et al. Effect of a plant-based, low-fat diet versus an animal-based, ketogenic diet on ad libitum energy intake. Nat Med 2021;27:344-53. ArticlePubMedPDF
- 15. Somagutta MR, Agadi K, Hange N, Jain MS, Batti E, Emuze BO, et al. Euglycemic diabetic ketoacidosis and sodium-glucose cotransporter-2 inhibitors: a focused review of pathophysiology, risk factors, and triggers. Cureus 2021;13:e13665.ArticlePubMedPMC
- 16. Nagaoka S. Fats and oils and health. Oleoscience 2014;14:237-42. Article
- 17. Cohen MP, Clements RS, Hud E, Cohen JA, Ziyadeh FN. Evolution of renal function abnormalities in the db/db mouse that parallels the development of human diabetic nephropathy. Exp Nephrol 1996;4:166-71. PubMed
- 18. Kobayashi S, Venkatachalam MA. Differential effects of calorie restriction on glomeruli and tubules of the remnant kidney. Kidney Int 1992;42:710-7. ArticlePubMed
- 19. Ishihara K, Mizunoya W, Uchida T, Shibakusa T, Mita Y, Fushiki T, et al. Effect of dietary soybean protein isolate on oxidation of dietary carbohydrate and diabetic disorders in diabetic obese mice. Soy Protein Res Jpn 2005;8:90-6.
- 20. Kitada M, Koya D. Diabetic nephropathy: Dietary therapy for diabetes mellitus from the viewpoint of “quality” and “quantity” of protein intake. Diabetic Complications 2020;34:281-4.
References
Figure & Data
REFERENCES
Citations
Citations to this article as recorded by 
 ePub Link
 Cite
CiteEffects of enteral nutrition formulas with varying carbohydrate amounts on glycemic control in diabetic mice


Fig. 1. Weight transition. Vales are presented as mean±standard deviation; ST versus LC (repeated measurement variance analysis). CT group, control group; DM group, db/db mice fed AIN‑93G; ST group, db/db mice fed the test diet ST (HINE E-Gel); LC group, db/db mice fed the test diet LC (HINE E-Gel LC).
Fig. 2. Changes in blood sugar levels from time to time. Vales are presented as mean±standard deviation. CT group, control group; DM group, db/db mice fed AIN‑93G; ST group, db/db mice fed the test diet ST (HINE E-Gel); LC group, db/db mice fed the test diet LC (HINE E-Gel LC).
Fig. 1.
Fig. 2.
Effects of enteral nutrition formulas with varying carbohydrate amounts on glycemic control in diabetic mice
| Component | Test food (per 100 kcal) | ||
|---|---|---|---|
| ST | LC | AIN-93G | |
| Protein (g) | 4.0 | 4.0 | 4.7 |
| Lipid (g) | 2.2 | 3.78 | 1.86 |
| Saturated fatty acids (g) | 0.85 | 1.33 | 0.29 |
| MCT (g) | 0.64 | 1.11 | - |
| Monounsaturated fatty acids (g) | 0.6 | 1.4 | 0.4 |
| n-6 fatty acids (g) | 0.39 | 0.53 | - |
| n-3 fatty acids (g) | 0.14 | 0.25 | - |
| Carbohydrates (g) | 16.76 | 13.25 | 17.09 |
| Sugars (g) | 15.38 | 11.75 | - |
| Dietary fiber (g) | 1.38 | 1.50 | - |
| Vitamin | |||
| Vitamin B₁ (mg) | 0.225 | 0.225 | 0.133 |
| Vitamin B₂ (mg) | 0.238 | 0.238 | 0.159 |
| Niacin (mgNE) | 2.25 | 2.25 | - |
| Vitamin B₆ (mg) | 0.30 | 0.30 | 0.16 |
| Folic acid (μg) | 30 | 30 | 53 |
| Vitamin B₁₂ (μg) | 0.30 | 0.50 | 0.66 |
| Biotin (μg) | 4.25 | 4.25 | 5.31 |
| Pantothenic acid (mg) | 1.25 | 1.25 | - |
| Vitamin C (mg) | 52.5 | 52.5 | - |
| Vitamin A (μg RE) | 67.5 | 67.5 | - |
| Vitamin A (IU) | 225 | 225 | 106 |
| Vitamin E (mg) | 2.38 | 2.38 | 1.99 |
| Vitamin D (μg) | 1.25 | 1.25 | - |
| Vitamin D (IU) | 50.0 | 50.0 | 26.6 |
| Vitamin K (μg) | 6.25 | 6.25 | 23.9 |
| Mineral | |||
| Sodium (mg) | 166.3 | 166.3 | 27.6 |
| Sodium (mEq) | 7.2 | 7.2 | |
| Salt equivalent (g) | 0.422 | 0.422 | 0.070 |
| Chloride (mg) | 151.3 | 194.4 | 43.3 |
| Chloride (mEq) | 4.3 | 5.5 | - |
| Potassium (mg) | 156.3 | 156.3 | 95.6 |
| Potassium (mEq) | 4.0 | 4.0 | - |
| Magnesium (mg) | 22.5 | 22.5 | 13.6 |
| Magnesium (mmol) | 0.9 | 0.9 | - |
| Calcium (mg) | 58.8, 1.47 | 58.8, 1.47 | 132.8 |
| Calcium (mmol) | 1.47 | 1.47 | - |
| Phosphorus (mg) | 82.5 | 82.5 | 79.7 |
| Phosphorus (mmol) | 2.6 | 2.7 | - |
| Chromium (μg) | 2.88 | 2.88 | 26.55 |
| Molybdenum (μg) | 5.0 | 5.0 | 4.0 |
| Manganese (mg) | 0.325 | 0.325 | 0.266 |
| Iron (mg) | 0.588 | 0.588 | 1.195 |
| Copper (mg) | 0.080 | 0.080 | 0.159 |
| Zinc (mg) | 1.20 | 1.20 | 1.01 |
| Selenium (μg) | 3.25 | 3.25 | 4.78 |
| Iodine (μg) | 13.8 | 13.8 | 5.31 |
| L-carnitine (mg) | - | 25 | - |
| Groupa | AUC mean | SD | SE | Median |
|---|---|---|---|---|
| DM (mg·min/dL) (n=4) | 52,170 | 4,887 | 2,444 | 53,505 |
| ST (mg·min/dL) (n=10) | 52,289 | 5,441 | 1,721 | 52,395 |
| LC (mg·min/dL) (n=10) | 52,099 | 6,036 | 1,909 | 52,384 |
| Reference groupa | Comparison group | t-statistic | P-value | Significance |
|---|---|---|---|---|
| DM | ST | 0.0358 | 0.9993 | NS |
| DM | LC | –0.0214 | 0.9997 | NS |
| ST | LC | –0.0756 | 0.9969 | NS |
| Measurement time | CT (n=4) | DM (n=4) | ST (n=10) | P-value | LC (n=10) |
|---|---|---|---|---|---|
| Before administration (kcal/day) | 13.59±2.64 | 21.85±2.18 | 20.79±5.92 | 0.6484 | 18.96±8.27 |
| 4 wk administration (kcal/day) | 15.20±1.91 | 23.85±1.50 | 17.55±3.50 | 0.6229 | 16.86±1.75 |
| 8 wk administration (kcal/day) | 14.63±2.16 | 21.57±2.35 | 18.03±1.75 | 0.0533 | 16.25±2.15 |
| CT (n=4) | DM (n=4) | ST (n=10) | P-value | LC (n=10) | |
|---|---|---|---|---|---|
| Tissue weights per body weight (g/kg) | |||||
| Epididymal adipose tissue | 14.66±1.19 | 28.56±2.12 | 27.60±3.06 | 0.7337 | 27.40±3.87 |
| Liver | 33.19±3.43 | 49.01±2.80 | 70.32±4.52 | 0.0010 | 61.56±4.21 |
| Kidney | 6.72±0.26 | 6.51±0.58 | 5.37±0.64 | 0.9698 | 5.39±0.68 |
| Gastrocnemius muscle | 3.96±0.16 | 1.71±0.19 | 1.62±0.26 | 0.4274 | 1.49±0.13 |
| Soleus muscle | 0.16±0.03 | 0.12±0.03 | 0.11±0.02 | 0.4727 | 0.11±0.03 |
| Tibialis anterior muscle | 1.50±0.05 | 0.64±0.09 | 0.63±0.05 | 0.0091 | 0.56±0.04 |
| Absolute tissue weights (g) | |||||
| Epididymal adipose tissue | 0.465±0.036 | 1.102±0.055 | 1.077±0.159 | 0.0640 | 1.193±0.151 |
| Liver | 1.056±0.141 | 1.900±0.218 | 2.731±0.136 | 0.6232 | 2.693±0.307 |
| Kidney | 0.213±0.014 | 0.251±0.011 | 0.208±0.018 | 0.0140 | 0.235±0.025 |
| Gastrocnemius muscle | 0.126±0.003 | 0.066±0.009 | 0.063±0.009 | 0.6232 | 0.065±0.005 |
| Soleus muscle | 0.005±0.001 | 0.004±0.001 | 0.004±0.001 | 0.3840 | 0.005±0.001 |
| Tibialis anterior muscle | 0.047±0.003 | 0.025±0.002 | 0.025±0.002 | 0.7052 | 0.025±0.002 |
| Measurement time | CT (n=4) | DM (n=4) | ST (n=10) | P-value | LC (n=10) | |
|---|---|---|---|---|---|---|
| Plasma glucose (mg/dL) | 8-wk administration | 287.8±27.4 | 870.0±89.1 | 1,034±167.3 | 0.0051 | 857.8±69.0 |
| Plasma glycoalbumin (%) | 8-wk administration | 3.2±0.3 | 11.6±0.9 | 12.1±1.5 | 0.0013 | 9.4±0.9 |
| HbA1c (%) | Before administration | 4.18±0.05 | 6.88±0.21 | 6.67±0.31 | 0.0514 | 6.60±0.34 |
| 4-wk administration | 4.33±0.10 | 13.48±0.56 | 12.72±0.95 | 12.13±1.47 | ||
| 8-wk administration | 4.25±0.13 | 13.53±0.66 | 13.06±0.83 | 11.83±1.08 |
| Measurement point | CT (n=4) | DM (n=4) | ST (n=10) | P-value | LC (n=10) | |
|---|---|---|---|---|---|---|
| U-ALB (μg/kg) | Before administration | 922±279 | 12,640±3,763 | 13,650±6,413 | 0.6776 | 13,174±3,926 |
| 4-wk administration | 512±229 | 10,970±2,544 | 6,360±1,463 | 0.3447 | 7,142±1,697 | |
| 8-wk administration | 458±210 | 13,908±4,173 | 6,934±2,087 | 0.7337 | 7,282±2,113 | |
| U-NAG (IU/kg) | Before administration | 2.59±0.93 | 2.93±0.42 | 2.96±0.56 | 0.5205 | 2.78±0.68 |
| 4-wk administration | 3.05±0.47 | 2.63±0.50 | 1.07±0.25 | 0.1859 | 1.15±0.15 | |
| 8-wk administration | 3.23±1.08 | 2.65±0.46 | 1.06±0.21 | 0.4727 | 1.15±0.26 |
| Variable | CT (n=4) | DM (n=4) | ST (n=10) | P-value | LC (n=10) |
|---|---|---|---|---|---|
| Total protein (g/dL) | 4.95±0.17 | 6.00±0.39 | 6.05±0.29 | 0.0848 | 6.29±0.27 |
| Albumin (g/dL) | 3.10±0.08 | 3.68±0.19 | 3.93±0.18 | 0.2769 | 3.91±0.29 |
| Blood urea nitrogen (mg/dL) | 18.0±2.2 | 23.4±2.3 | 29.2±6.2 | 0.0058 | 22.2±3.7 |
| Total cholesterol (mg/dL) | 107.5±13.1 | 146.0±11.5 | 129.1±16.3 | 0.0125 | 155.2±26.6 |
| Triglycerides (mg/dL) | 37.3±13.2 | 121.5±51.2 | 155.5±61.8 | 0.6232 | 148.0±71.7 |
Table 1. Nutritional components of test foods
ST, HINE E-Gel; LC, HINE E-Gel LC; MCT, medium-chain triglyceride.
Table 2. Grouping based on AUC
AUC, area under the curve; DM group, db/db mice fed AIN‑93G; ST group, db/db mice fed the test diet ST (HINE E-Gel); LC group, db/db mice fed the test diet LC (HINE E-Gel LC). aTolerance range: 2,691.
Table 3. Tukey-type multiple comparison test of AUC
DM group, db/db mice fed AIN‑93G; ST group, db/db mice fed the test diet ST (HINE E-Gel); LC group, db/db mice fed the test diet LC (HINE E-Gel LC); NS, no significant difference. aTolerance range: 2,691.
Table 4. Daily calorie intake
Values are presented as mean±standard deviation. CT group, control group; DM group, db/db mice fed AIN‑93G; ST group, db/db mice fed the test diet ST (HINE E-Gel); LC group, db/db mice fed the test diet LC (HINE E-Gel LC).
Table 5. Tissue weights at 8 weeks after administration
Values are presented as mean±standard deviation. CT group, control group; DM group, db/db mice fed AIN‑93G; ST group, db/db mice fed the test diet ST (HINE E-Gel); LC group, db/db mice fed the test diet LC (HINE E-Gel LC). ST versus LC (Wilcoxon two-group comparison test).
Table 6. Blood glucose control indicators
Values are presented as mean±standard deviation. CT group, control group; DM group, db/db mice fed AIN‑93G; ST group, db/db mice fed the test diet ST (HINE E-Gel); LC group, db/db mice fed the test diet LC (HINE E-Gel LC); HbA1c, glycated hemoglobin. ST versus LC (Wilcoxon two-group comparison test).
Table 7. Renal function tests
Values are presented as mean±standard deviation. CT group, control group; DM group, db/db mice fed AIN‑93G; ST group, db/db mice fed the test diet ST (HINE E-Gel); LC group, db/db mice fed the test diet LC (HINE E-Gel LC); U-ALB, urinary albumin; U-NAG, urinary N-acetylglucosaminidase. ST versus LC (Wilcoxon two-group comparison test).
Table 8. Blood biochemistry tests (after 8 weeks of administration)
Values are presented as mean±standard deviation. CT group, control group; DM group, db/db mice fed AIN‑93G; ST group, db/db mice fed the test diet ST (HINE E-Gel); LC group, db/db mice fed the test diet LC (HINE E-Gel LC). ST versus LC (Wilcoxon two-group comparison test).

