Warning: mkdir(): Permission denied in /home/virtual/lib/view_data.php on line 81

Warning: fopen(upload/ip_log/ip_log_2024-12.txt): failed to open stream: No such file or directory in /home/virtual/lib/view_data.php on line 83

Warning: fwrite() expects parameter 1 to be resource, boolean given in /home/virtual/lib/view_data.php on line 84
Postoperative Weight Changes, Nutritional Status and Clinical Significance of Colorectal Cancer Patients
Skip Navigation
Skip to contents

Ann Clin Nutr Metab : Annals of Clinical Nutrition and Metabolism

OPEN ACCESS

Articles

Page Path
HOME > Surgical Metabolism and Nutrition > Volume 10(2); 2019 > Article
ORIGINAL ARTICLE Postoperative Weight Changes, Nutritional Status and Clinical Significance of Colorectal Cancer Patients
Sun Young Kim, A.D, Ji Sun Kim, M.D, Eon Chul Han, M.D.
Surgical Metabolism and Nutrition 2019;10(2):46-53.
DOI: https://doi.org/10.18858/smn.2019.10.2.46
Published online: December 30, 2019

Department of Surgery, Dongnam Institute of Radiological and Medical Sciences, Busan, Korea

Department of Surgery, Dongnam Institute of Radiological and Medical Sciences, Busan, Korea

Correspondence to: Eon Chul Han, Department of Surgery, Dongnam Institute of Radiological and Medical Sciences, 40 Jwadong-gil, Jangan-eup, Gijang-gun, Busan 46033, Korea Tel: +82-51-720-5034, Fax: +82-51-720-5914, E-mail: eonchulhan@gmail.com
• Received: July 26, 2019   • Accepted: September 17, 2019
The results of this study were presented by poster at the Korean Society of Coloproctology 2018, Kwangju, Republic of Korea held from 30th march to 1st April 2018.

Copyright: © The Korean Society of Surgical Metabolism and Nutrition

This is an open access article distributed under the terms of the Creative Commons Attribution Non-Commercial License (http://creativecommons.org/licenses/by-nc/4.0) which permits unrestricted non-commercial use, distribution, and reproduction in any medium, provided the original work is properly cited.

  • 4 Views
  • 0 Download
prev next
  • Purpose:
    Although weight loss is an important factor for assessing the nutritional status, patient counselling or management is limited due to fewer studies on weight loss after colorectal cancer surgery.
  • Materials and Methods:
    Totally, 374 patients were included in the analysis (between August 2010 to December 2016). Patients’ weight was determined before surgery, and at 1 week, 6 weeks, 3 months, and 6 months after surgery. Change in weight was reviewed based on the gender and administration of chemotherapy. Severe weight loss is defined as greater than 5% weight loss after surgery.
  • Results:
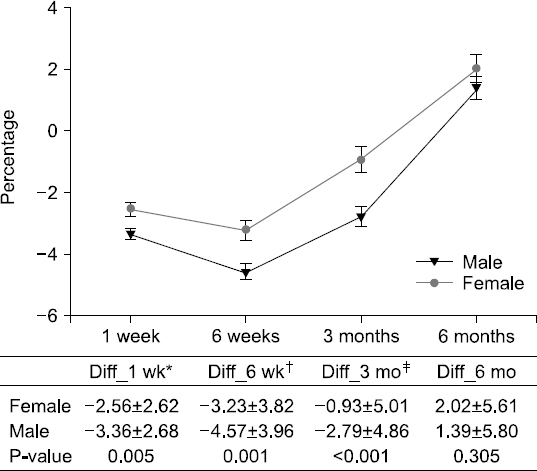
    The weight changes post-surgery at 1 week (−2.56±2.62 vs. −3.36±2.68, P<0.005), 6 weeks (−3.23±3.82 vs. −4.57±3.96, P=0.001), and 3 months (−0.93±5.01 vs. −2.79±4.86, P<0.001) were significantly greater in male subjects, as compared to female patients. However, at 6 months post-surgery, most patients showed weight gain with no statistical significance between the genders (1.11±4.64 vs. 1.94±6.26, P=0.143). Weight change based on treatment (with or without chemotherapy) reveal significant differences between the genders at 3 months post-surgery only (−1.33±4.65 vs. −2.52 ±5.15, P=0.027). Multivariate analysis for factors of severe weight loss show that the male gender [adjusted odds ratio (OR): 1.83, P=0.027)], adjuvant chemotherapy (adjusted OR 2.11, P=0.008), and presence of post-operative complications (adjusted OR 2.12, P=0.029) were significant factors.
  • Conclusion:
    In postoperative colorectal cancer patients, the weight and nutritional status require careful monitoring for at least 2 months after surgery, in order to prevent hindrance to chemotherapy. (Surg Metab Nutr 2019;10:-53)
Colorectal cancer (CRC) is the 3rd most common cancer in the world and the 4th leading cause of cancer-related death.[1] In Korea, CRC is the third most common cancer, with increasing number of patients undergoing surgery for this condition and CRC is continuously increasing in incidence due to Westernized diet and increase in alcohol intake and smoking.[2] Many studies have been conducted and showed that postoperative weight change in patients who underwent gastrectomy for gastric cancer is mainly due to decreased oral intake and absorption disorders due to reduced passing time.[3-5] However, clinically, most patients who undergo surgery for CRC also commonly experience weight loss. Even though weight loss is an important factor in nutritional assessment, patient counselling or management has been limited due to the limited number of studies on weight loss after CRC surgery.[6] Involuntary weight loss is the basic diagnostic criterion for cancer cachexia and is known to be related to toxicity of chemotherapy.[7,8] In particular, weight loss commonly occurs due to nausea and dyspepsia after chemotherapy. However, this is difficult to explain to patients due to the lack of studies on weight loss after colorectal surgery. Therefore, this study aims to explore the change in weight and nutritional status after surgery in CRC patients as well as factors that affect severe weight loss.
This study is a retrospective study based on data from prospectively collected database. This study was reviewed and approved by the Institutional Review Board of the Dongnam Institute of Radiological and Medical Sciences and this study was waived of the requirement for patient’s informed consent (D-1904-017-002). Out of 443 patients who underwent colectomy at the Department of Colorectal Surgery at our institution between August 2010 and December 2016, total of 374 patients were included in the analysis, excluding 69 patients who underwent stoma formation surgery and those who did not undergo weight measurement and tests. The following baseline characteristics were collected: sex, age, American Society of Anesthesiologists (ASA) classification, body mass index (BMI), hemoglobin level, serum albumin level, carcinoembryonic antigen (CEA) level, method of operation (open and laparoscopy), hospital stay, early complication, adjuvant chemotherapy. Cancer stage and location of tumor (right, left, or rectum) were investigated through postoperative histopathological test results. Patients’ weight was measured before surgery and 1 week, 6 weeks, 3 months, and 6 months after surgery. Change in weight was explored according to patients’ sex and whether they were treated with adjuvant chemotherapy. Severe weight loss was defined as greater than 5% weight loss after surgery compared to preoperative state. Patients’ nutritional status was evaluated using Instant Nutritional Assessment (INA). INA was measured before and 6 months after surgery. INA grade 1 is defined as albumin ≥3.5 g/dL and lymphocyte count ≥1500/μL. INA grade 2 is defined as albumin ≥3.5 g/dL and lymphocyte count <1500/μL. INA grade 3 is defined as albumin <3.5 g/dL and lymphocyte count ≥1500/μL. INA grade 4 is defined as albumin <3.5 g/dL and lymphocyte count < 1500/μL. Among these, INA grade 1 was defined as good nutritional status. Anemia was defined as <13 g/dL in male and <12 g/dL in female. TNM stage 0, I, and II were defined as non-advanced stage, and III and IV were defined as advanced stage.
1. Statistical analysis
Statistical analysis was performed using SPSS version 21.0 (IBM Corporation, Armonk, NY, USA). Comparison of categorical variables between two groups was performed using Pearson’s χ2 test or Fisher’s exact test. Student’s t-test was used for the comparison of continuous variables between the two groups. For factors that can influence greater than 5% weight loss at 3 months post-surgery compared to pre-surgery period, multiple analysis was performed using logistic regression on the factors with P<0.1. P value ≤0.05 was considered statistically significant.
Out of 374 patients, 231 (61.8%) were male, and the average age was 63.8. In this study, 137 patients (36.6%) did not receive adjuvant chemotherapy and 237 patients (63.4%) received adjuvant chemotherapy. Two hundred forty-four patients (65.2%) had good INA status, and 270 (72.2%) underwent laparoscopic surgery. One hundred eighty-six patients (49.7%) had advanced stage by TNM staging. In the group that received adjuvant chemotherapy, patients’ age was significantly younger, and the number of cases of open surgery were significantly higher. CEA level was also significantly higher. The incidence of severe weight loss after surgery was significantly higher in patients who received chemotherapy 3 months after surgery (Table 1).
Table 1
Demographic data and clinical characteristics according to whether they were treated with chemotherapy
Total number of patients or average (N=374) Patients without chemotherapy (N=137) Patients with chemotherapy (N=237) P-value
Sex 0.599
 Male 231 (61.8%) 87 (63.5%) 144 (60.8%)
 Female 143 (38.2%) 50 (36.5%) 93 (39.2%)
Age (mean±SD, years) 63.8±11.2 65.6±11.6 62.8±10.8 0.021
Body mass index (mean±SD, kg/m2) 23.4±3.3 23.7±3.2 23.2±3.4 0.253
ASA 0.116
 1 180 (48.1%) 59 (43.1%) 121 (51.0%)
 2 183 (48.8%) 71 (51.8%) 112 (47.3%)
 3 11 (2.9%) 7 (5.1%) 4 (1.7%)
Instant nutrition assessment 0.932
 Good 244 (65.2%) 89 (65.0%) 155 (65.4%)
 Poor 130 (34.8%) 48 (35.0%) 82 (34.6%)
Location of colorectal cancer 0.195
 Right 130 (34.8%) 45 (32.8%) 85 (35.9%)
 Left 177 (47.3%) 61 (44.5%) 116 (48.9%)
 Rectum 67 (17.9%) 31 (22.7%) 36 (15.2%)
Method of operation 0.001
 Open 104 (27.8%) 24 (17.5%) 80 (33.8%)
 Laparoscopy 270 (72.2%) 113 (82.5%) 157 (66.2%)
TNM stage <0.001
 0 13 (3.5%) 13 (9.5%) 0 (0.0%)
 1 77 (20.6%) 77 (56.2%) 0 (0.0%)
 2 98 (26.2%) 34 (24.8%) 64 (27.0%)
 3 135 (36.1%) 11 (8.0%) 124 (52.3%)
 4 51 (13.6%) 2 (1.5%) 49 (20.7%)
Complication 0.303
 No 328 (87.7%) 117 (85.4%) 211 (89.0%)
 Yes 46 (12.3%) 20 (14.6%) 26 (11.0%)
Length of stay (mean±SD, days) 10.1±3.9 9.6±3.6 10.3±4.2 0.086
CEA (ng/mL) 13.2±46.6 3.7±4.2 18.7±57.6 <0.001
 ≤5 253 (67.6%) 111 (81.0%) 142 (59.9%) <0.001
 >5 121 (32.4%) 26 (19.0%) 95 (40.1%)
Severe weight loss
 Postoperative 1 week 76 (20.3%) 21 (15.3%) 55 (23.2%) 0.068
 Postoperative 6 weeks 138 (36.9%) 42 (30.7%) 96 (40.5%) 0.057
 Postoperative 3 months 87 (23.3%) 23 (16.8%) 64 (27.0%) 0.024
 Postoperative 6 months 32 (8.6%) 8 (5.8%) 24 (10.1%) 0.153
In order to assess patients’ nutritional status, INA was measured before surgery and 6 months after surgery. Patients who underwent chemotherapy had significantly lower levels of albumin and hemoglobin and showed significantly higher incidence of anemia. There was no significant difference in INA between the two groups before surgery. Albumin and hemoglobin level increased at 6 months after surgery in both groups, but the difference was significantly smaller in the chemotherapy group. Anemia also improved after surgery, but the proportion of anemic patients was still higher in the chemotherapy group (Table 2). Table 3 shows INA in 4 groups, allocated by whether they were treated with chemotherapy and gender.
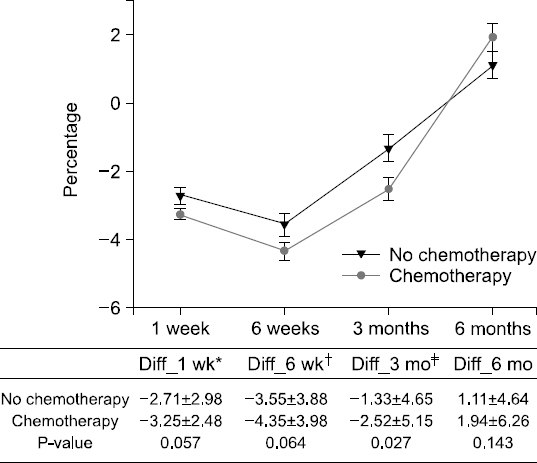
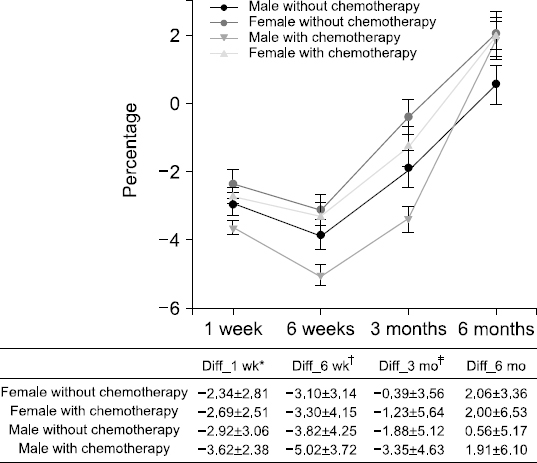
Weight change after surgery was explored in each gender and expressed in percentage change from preoperative weight. In male patients, weight change at 1week post-surgery (−2.56±2.62 vs. −3.36±2.68, P <0.005), 6 weeks post-surgery (−3.23±3.82 vs. −4.57± 3.96, P=0.001), and 3 months post-surgery (−0.93±5.01 vs. −2.79±4.86, P<0.001) was significantly greater than female patients. At 6 months post-surgery, weight gain was seen in both groups, with no significant difference between the two groups (1.11±4.64 vs. 1.94±6.26, P=0.143) (Fig. 1). Weight change by whether they were treated with chemotherapy showed significant difference between the two groups at 3 months post-surgery only (−1.33±4.65 vs. −2.52±5.15, P=0.027) (Fig. 2). When patients were allocated into 4 groups by whether they were treated with chemotherapy and gender, male patients who underwent chemotherapy showed marked weight loss (Fig. 3). Male patients who underwent chemotherapy showed significantly greater weight loss at 1 week (−3.62±2.38 vs. −2.67±2.79, P=0.001), 6 weeks (−5.02±3.72 vs. −3.46±3.99, P<0.001), and 3 months post-surgery (−3.35±4.63 vs. −1.29±5.06, P<0.001) compared to others. However, at 6 months post-surgery, most patients showed weight gain with no statistical significance between groups (1.91±6.10 vs. 1.47±5.49, P=0.486).
Table 2
Nutritional assessment compared with preoperative and postoperative according to whether they were treated with chemotherapy
Preoperative status Postoperative after 6 months


Patients without chemotherapy (N=137) Patients with chemotherapy (N=237) P-value Patients without chemotherapy (N=137) Patients with chemotherapy (N=237) P-value
Lymphocyte 1847±639 1790±608 0.387 1950±662 1759±658 0.007
 <1500/μL 118 (86.1%) 203 (85.7%) 0.899 34 (68.0%) 38 (76.0%) 0.387
 ≥1500/μL 19 (13.9%) 34 (14.3%) 16 (32.0%) 12 (24.0%)
Albumin 4.1±0.4 4.0±0.5 0.022 4.2±0.4 4.1±0.4 0.007
 <3.5 g/dL 128 (93.4%) 216 (91.1%) 0.432 135 (98.5%) 235 (99.2%) 0.577
 ≥3.5 g/dL 9 (6.6%) 21 (8.9%) 2 (1.5%) 2 (0.8%)
Hemoglobin 12.9±2.0 12.3±2.1 0.009 13.1±1.6 12.7±1.7 0.043
Anemia 0.009 0.009
 No 84 (61.3%) 112 (47.3%) 95 (69.3%) 132 (55.7%)
 Yes 28 (38.7%) 125 (52.7%) 42 (30.7%) 105 (44.3%)
Instant nutrition assessment 0.932 0.021
 Good 88 (65.0%) 155 (65.4%) 101 (73.7%) 147 (62.0%)
 Poor 49 (35.0%) 82 (34.6%) 36 (26.3%) 90 (38.0%)
 1 88 (64.2%) 155 (65.4%) 0.276 101 (73.7%) 147 (62.0%) 0.048
 2 40 (29.2%) 61 (25.7%) 0 (0.0%) 2 (0.8%)
 3 4 (2.9%) 3 (1.3%) 34 (24.8%) 87 (36.7%)
 4 5 (3.7%) 18 (7.6%) 2 (1.5%) 1 (0.4%)
Table 3
Nutritional assessment compared with preoperative and postoperative according to patients’ sex and whether they were treated with chemotherapy
Male patients without chemotherapy (N=87) Female patients without chemotherapy (N=50) Male patients with chemotherapy (N=144) Female patients with chemotherapy (N=93)


Preoperative 6 months after surgery Preoperative 6 months after surgery Preoperative 6 months after surgery Preoperative 6 months after surgery
Lymphocyte 1868±670 1935±676 1811±587 1977±643 1828±633 1814±678 1731±565 1674±619
 <1500/μL 59 (67.8%) 63 (72.4%) 34 (68.0%) 38 (76.0%) 98 (68.1%) 96 (66.7%) 60 (64.5%) 52 (55.9%)
 ≥1500/μL 28 (32.2%) 24 (27.6%) 16 (32.0%) 12 (24.0%) 46 (31.9%) 48 (33.3%) 33 (35.5%) 41 (44.1%)
Albumin 4.2±0.4 4.2±0.3 4.1±0.5 4.2±0.3 4.1±0.4 4.1±0.3 3.9±0.5 4.1±0.3
 <3.5 g/dL 85 (94.3%) 85 (97.7%) 46 (92.0%) 50 (100%) 135 (93.8%) 142 (98.6%) 81 (87.1%) 93 (100%)
 ≥3.5 g/dL 5 (5.7%) 2 (2.3%) 4 (8.0%) 0 (0.0%) 9 (6.3%) 2 (1.4%) 12 (12.9%) 0 (0.0%)
Hemoglobin 13.6±2.0 13.6±1.5 11.8±1.6 12.2±1.2 13.1±2.1 13.3±1.7 11.2±1.5 11.9±1.2
Anemia
 No 59 (67.8%) 62 (71.3%) 25 (50.0%) 33 (66.0%) 84 (58.3%) 88 (61.1%) 28 (30.1%) 44 (47.3%)
 Yes 28 (32.2%) 25 (28.7%) 25 (50.0%) 17 (34.0%) 60 (41.7%) 56 (38.9%) 65 (69.9%) 49 (52.7%)
Instant nutrition assessment grade
 1 57 (65.5%) 63 (72.4%) 31 (62.0%) 38 (76.0%) 97 (67.4%) 95 (66.0%) 58 (62.3%) 52 (55.9%)
 2 25 (28.7%) 22 (25.3%) 15 (30.0%) 12 (24.0%) 38 (26.4%) 2 (1.4%) 23 (24.7%) 0 (0.0%)
 3 2 (2.3%) 0 (0.0%) 3 (4.0%) 0 (0.0%) 1 (0.6%) 46 (31.9%) 2 (2.2%) 41 (44.1%)
 4 3 (3.4%) 2 (2.3%) 3 (4.0%) 0 (0.0%) 8 (5.6%) 1 (0.7%) 10 (10.8%) 0 (0.0%)
Weight loss was significantly severe at 3 months post-surgery. Upon univariate analysis, male gender, adjuvant chemotherapy, rectal tumor, and presence of complication contributed to greater than 5% weight loss compared to preoperative status. Upon multivariate analysis for these factors, male gender [adjusted odds ratio (OR): 1.83, 95% confidence interval (CI): 1.07∼3.13, P=0.027), adjuvant chemotherapy (adjusted OR: 2.11, 95% CI: 1.22∼3.65, P=0.008) and presence of post-operative complication (adjusted OR: 2.12, 95% CI: 1.08∼4.17, P=0.029) were significant (Table 4).
Fig. 1
Weight change after surgery between male and female patients. *Diff_1 wk=(body weight of postoperative 1 week-preoperative body weight)/ preoperative body weight. Diff_6 wk=(body weight of postoperative 6 week-preoperative body weight)/preoperative body weight. Diff_3 mo= (body weight of postoperative 3 month-preoperative body weight)/preoperative body weight.
SMN_10_046_fig_1.jpg
Fig. 2
Weight change after surgery with or without chemotherapy. *Diff_1 wk=(body weight of postoperative 1 week-preoperative body weight)/ preoperative body weight. Diff_6 wk=(body weight of postoperative 6 week-preoperative body weight)/preoperative body weight. Diff_3 mo= (body weight of postoperative 3 month-preoperative body weight)/preoperative body weight.
SMN_10_046_fig_2.jpg
Fig. 3
Weight change of 4 groups by gender and whether they were treated with chemotherapy. *Diff_1 wk=(body weight of postoperative 1 week-preoperative body weight)/ preoperative body weight. Diff_6 wk=(body weight of postoperative 6 week-preoperative body weight)/preoperative body weight. Diff_3 mo= (body weight of postoperative 3 month-preoperative body weight)/preoperative body weight.
SMN_10_046_fig_3.jpg
Table 4
Factors for severe weight loss at 3 months post-surgery after univariate and multivariate analyses.
Patients with weight loss over -5% of postoperative after 3months

Univariate analysis Multivariate analysis


Patients with weight loss over -5% n (%) P Adjusted odds ratio (95% confidence interval) P
Sex 0.016 0.027
 Female 24/143 (16.8) 1
 Male 64/231 (27.7) 1.83 (1.07~3.13)
Age 0.677
 <65 years 45/148 (24.5)
 ≥65 years 43/147 (22.6)
ASA 0.151
 I 36/178 (20.2)
 II and III 52/144 (26.5)
Body mass index 0.295
 <25 56/255 (22.0)
 ≥25 32/119 (26.9)
Comorbidity 0.292
 No 35/167 (21.0)
 Yes 53/207 (25.6)
Location of colorectal cancer 0.096 0.100
 Right and Left 67/307 (21.8) 1
 Rectum 21/67 (31.3) 1.66 (0.91~3.05)
Instant nutrition assessment 0.508
 Good 60/244 (24.6)
 Poor 28/130 (21.5)
CEA (ng/mL) 0.510
 ≤5 57/253 (22.5)
 >5 31/121 (25.6)
Method of operation 0.677
 Open 26/104 (25.0)
 Laparoscopy 62/270 (23.0)
Chemotherapy 0.019 0.008
 No 23/137 (16.8) 1
 Yes 65/237 (27.4) 2.11 (1.22~3.65)
Complication 0.022 0.029
 No 71/328 (21.6) 1
 Yes 17/46 (37.0) 2.12 (1.08~4.17)
Cancer stage 0.202
 Non-advanced 39/188 (20.7)
 Advanced 49/186 (26.3)
Anemia 0.135
 No 40/196 (20.4)
 Yes 48/178 (27.0)
Albumin 0.979
 <3.5 g/dL 81/344 (23.5)
 ≥3.5 g/dL 7/30 (23.3)
Lymphocyte 0.593
 <1500/μL 74/321 (23.1)
 ≥1500/μL 14/53 (23.5)
This study explored the change in nutritional status and weight after surgery according to adjuvant chemotherapy and gender in colorectal cancer patients. According to this study, nutritional status at 6 months post-surgery was better in patients who did not receive adjuvant chemotherapy compared to those who received adjuvant chemotherapy. In particular, male patients who underwent adjuvant chemotherapy showed the most severe weight loss. Weight loss was the most severe at 3 months post-surgery. Greater than 5% weight loss at 3 months post-surgery compared to pre-surgery period was more frequent in male patients, patients who received adjuvant chemotherapy, and patients who showed postoperative complications.
Weight change is a good tool to assess the patient’s nutritional status.[9] For gastrointestinal cancer, there are studies that investigate weight change in gastric cancer patients whose nutritional intake decreased after surgery, but the number of studies that evaluate the weight change in colorectal cancer patients is limited. Therefore, this study explored weight change in colorectal cancer patients by assessing patient weight at pre-operative, 1-week post-operative, 6 weeks post-operative, and 3 months post-operative periods. Additionally, markers that can represent patient status, such as hemoglobin level, albumin level, and INA, were also studied. This study confirmed that chemotherapy is associated with higher risk of malnutrition and risk. In particular, this study showed that male patients who undergo chemotherapy show significantly greater weight loss at 1 week, 6 weeks, and 3 months after surgery compared to the rest of the population. This study also showed that, regardless of adjuvant chemotherapy and gender, patients tend to recover to pre-operative weight or even show weight gain by 6 months after surgery. The proportion of patients who showed severe weight loss was 30.7% in patients who did not undergo chemotherapy 6 weeks after surgery, versus 40.5% in patients who did. This proportion decreased to 8% and 10.1%, respectively, 6 months after surgery. In advanced colorectal patients, post-operative chemotherapy has a significant impact on survival rate.[10] It has previously been reported that, in advanced colorectal patients over the age of 70, malnutrition decreases survival and compliance to chemotherapy.[11] Another study reported increased socioeconomic cost.[12] Severe post-operative weight loss leading to delay or poor compliance of chemotherapy may adversely affect patient’s survival. Considering that the timing of post-operative chemotherapy is between 4 to 8 weeks post-surgery, close monitoring of weight loss and malnutrition as well as active management including nutrition consultation are required during the 2-month period after surgery, before chemotherapy initiation. Also, severe weight loss should be prevented through thorough perioperative patient education that provides accurate information on weight loss. In addition, better nutritional support must be considered through early oral feeing via enhanced recovery after surgery program.[13,14]
In this study, incidence of severe weight loss showed significant difference between patients who received chemotherapy 3 months after surgery and patients who did not. We investigated risk factors that may contribute to severe weight loss. Post-operative malnutrition or sarcopenia has been shown to increase post-operative complication.[15-17] This study showed that post-operative complication can be a risk factor for weight loss at 3 months after surgery. Upon comparison of 46 patients who experienced post-operative complications and those who did not, weight loss in patients who developed post-operative complications showed numerically greater weight loss at 6 weeks (−5.09% vs −3.91%, P=0.059) and 3 months (−2.94 vs. −1.96, P=0.215) after surgery, though results were not statistically significant. Certain complications that arise after colorectal cancer surgery, such as anastomosis site leakage, intrapelvic abscess, and ileus, can lead to long-term restriction of oral intake and subsequent severe weight loss. Complications are also associated with anemia, which was investigated in this study. Pre-operative anemia is common in colorectal cancer, occurring up to 70% of patients.[18,19] In this study, 40.9% of total population had pre-operative anemia. Pre-operative anemia is known to be related to increased incidence of post-operative complication.[18-20] As pre-operative anemia can affect weight loss by inducing post-operative complication, pre-operative anemia must also be corrected.
In this study, the albumin level was significantly higher during the preoperative and 6-month postoperative periods in patients who did not receive chemotherapy. The decreased albumin level in patients who underwent chemotherapy can be thought to be due to the advanced stage of disease and associated cancer cachexia.[21] Cancer cachexia can occur due to immune activation from cancer-related cytokine production,[22] metabolic changes related to hormones,[23] and decreased nutrient absorption through the gastrointestinal tract.[24]
This study is limited by the fact that sample size is small and that it is a retrospective study. The short follow-up period of 6 months after surgery is also a limitation. Further studies with bigger sample size and prospective study design are required to explore the association between postoperative weight loss, nutritional status, and oncological results through longer follow-up period.
In conclusion, this study confirmed that weight loss can be seen until 3 months after surgery in colorectal cancer, before recovery to pre-operative weight is seen at 6 months after surgery. Risk of severe weight loss is shown to be higher in male patients, in patients who receive chemotherapy, and patients who develop post-operative complications. Therefore, in patients who require chemotherapy, weight and nutritional status must be carefully monitored for at least 2 months after surgery in order to prevent hinderance to chemotherapy.
  • 1. Parkin DM, Bray F, Ferlay J, Pisani P. Global cancer statistics 2002. CA Cancer J Clin 2005;55:74-108. ArticlePubMed
  • 2. Baek Y, Yi M. Factors influencing quality of life during chemotherapy for colorectal cancer patients in South Korea. J Korean Acad Nurs 2015;45:604-12. ArticlePubMedPDF
  • 3. Wie GA, Cho YA, Kim SY, Kim SM, Bae JM, Joung H. Prevalence and risk factors of malnutrition among cancer patients according to tumor location and stage in the National Cancer Center in Korea. Nutrition 2010;26:263-8. ArticlePubMed
  • 4. Bae JM, Kim S, Kim YW, Ryu KW, Lee JH, Noh JH, et al. Health-related quality of life among disease-free stomach cancer survivors in Korea. Qual Life Res 2006;15:1587-96. ArticlePubMedPDF
  • 5. Yu W, Seo BY, Chung HY. Postoperative body-weight loss and survival after curative resection for gastric cancer. Br J Surg 2002;89:467-70. ArticlePubMedPDF
  • 6. Arends J, Baracos V, Bertz H, Bozzetti F, Calder PC, Deutz NEP, et al. ESPEN expert group recommendations for action against cancer-related malnutrition. Clin Nutr 2017;36:1187-96. ArticlePubMed
  • 7. Dewys WD, Begg C, Lavin PT, Band PR, Bennett JM, Bertino JR, et al. Prognostic effect of weight loss prior to chemotherapy in cancer patients. Eastern Cooperative Oncology Group. Am J Med 1980;69:491-7.
  • 8. Martin L, Senesse P, Gioulbasanis I, Antoun S, Bozzetti F, Deans C, et al. Diagnostic criteria for the classification of cancer-associated weight loss. J Clin Oncol 2015;33:90-9. ArticlePubMed
  • 9. Ravasco P, Monteiro-Grillo I, Vidal PM, Camilo ME. Nutritional deterioration in cancer:the role of disease and diet. Clin Oncol (R Coll Radiol) 2003;15:443-50. ArticlePubMed
  • 10. Cunningham D, Atkin W, Lenz HJ, Lynch HT, Minsky B, Nordlinger B, et al. Colorectal cancer. Lancet 2010;375:1030-47. ArticlePubMed
  • 11. Aaldriks AA, van der Geest LG, Giltay EJ, le Cessie S, Portielje JE, Tanis BC, et al. Frailty and malnutrition predictive of mortality risk in older patients with advanced colorectal cancer receiving chemotherapy. J Geriatr Oncol 2013;4:218-26. ArticlePubMed
  • 12. Schwegler I, von Holzen A, Gutzwiller JP, Schlumpf R, Mühlebach S, Stanga Z. Nutritional risk is a clinical predictor of postoperative mortality and morbidity in surgery for colorectal cancer. Br J Surg 2010;97:92-7. ArticlePubMedPDF
  • 13. Eskicioglu C, Forbes SS, Aarts MA, Okrainec A, McLeod RS. Enhanced recovery after surgery (ERAS) programs for patients having colorectal surgery:a meta-analysis of randomized trials. J Gastrointest Surg 2009;13:2321-9. ArticlePubMedPDF
  • 14. Zhuang CL, Ye XZ, Zhang XD, Chen BC, Yu Z. Enhanced recovery after surgery programs versus traditional care for colorectal surgery:a meta-analysis of randomized controlled trials. Dis Colon Rectum 2013;56:667-78. PubMed
  • 15. Maurício SF, Xiao J, Prado CM, Gonzalez MC, Correia MITD. Different nutritional assessment tools as predictors of postoperative complications in patients undergoing colorectal cancer resection. Clin Nutr 2018;37:1505-11. ArticlePubMed
  • 16. Huang DD, Wang SL, Zhuang CL, Zheng BS, Lu JX, Chen FF, et al. Sarcopenia, as defined by low muscle mass, strength and physical performance, predicts complications after surgery for colorectal cancer. Colorectal Dis 2015;17:O256-64. ArticlePubMed
  • 17. Reisinger KW, van Vugt JL, Tegels JJ, Snijders C, Hulsewé KW, Hoofwijk AG, et al. Functional compromise reflected by sarcopenia, frailty, and nutritional depletion predicts adverse postoperative outcome after colorectal cancer surgery. Ann Surg 2015;261:345-52. ArticlePubMed
  • 18. Musallam KM, Tamim HM, Richards T, Spahn DR, Rosendaal FR, Habbal A, et al. Preoperative anaemia and postoperative outcomes in non-cardiac surgery:a retrospective cohort study. Lancet 2011;378:1396-407. ArticlePubMed
  • 19. Leichtle SW, Mouawad NJ, Lampman R, Singal B, Cleary RK. Does preoperative anemia adversely affect colon and rectal surgery outcomes? J Am Coll Surg 2011;212:187-94. ArticlePubMed
  • 20. Han EC, Ryoo SB, Park BK, Park JW, Lee SY, Oh HK, et al. Surgical outcomes and prognostic factors of emergency surgery for colonic perforation:would fecal contamination increase morbidity and mortality? Int J Colorectal Dis 2015;30:1495-504. ArticlePubMedPDF
  • 21. Inagaki J, Rodriguez V, Bodey GP. Proceedings:causes of death in cancer patients. Cancer 1974;33:568-73. ArticlePubMed
  • 22. Espat NJ, Moldawer LL, Copeland EM 3rd. Cytokine-mediated alterations in host metabolism prevent nutritional repletion in cachectic cancer patients. J Surg Oncol 1995;58:77-82. ArticlePubMed
  • 23. De Blaauw I, Deutz NE, Von Meyenfeldt MF. Metabolic changes of cancer cachexia--second of two parts. Clin Nutr 1997;16:223-8. Article
  • 24. Kern KA, Norton JA. Cancer cachexia. JPEN J Parenter Enteral Nutr 1988;12:286-98. ArticlePubMed

Figure & Data

REFERENCES

    Citations

    Citations to this article as recorded by  

      • Cite
        CITE
        export Copy Download
        Close
        Download Citation
        Download a citation file in RIS format that can be imported by all major citation management software, including EndNote, ProCite, RefWorks, and Reference Manager.

        Format:
        • RIS — For EndNote, ProCite, RefWorks, and most other reference management software
        • BibTeX — For JabRef, BibDesk, and other BibTeX-specific software
        Include:
        • Citation for the content below
        Postoperative Weight Changes, Nutritional Status and Clinical Significance of Colorectal Cancer Patients
        Ann Clin Nutr Metab. 2019;10(2):46-53.   Published online December 30, 2019
        Close
      • XML DownloadXML Download
      Figure
      • 0
      • 1
      • 2
      Postoperative Weight Changes, Nutritional Status and Clinical Significance of Colorectal Cancer Patients
      Image Image Image
      Fig. 1 Weight change after surgery between male and female patients. *Diff_1 wk=(body weight of postoperative 1 week-preoperative body weight)/ preoperative body weight. †Diff_6 wk=(body weight of postoperative 6 week-preoperative body weight)/preoperative body weight. ‡Diff_3 mo= (body weight of postoperative 3 month-preoperative body weight)/preoperative body weight.
      Fig. 2 Weight change after surgery with or without chemotherapy. *Diff_1 wk=(body weight of postoperative 1 week-preoperative body weight)/ preoperative body weight. †Diff_6 wk=(body weight of postoperative 6 week-preoperative body weight)/preoperative body weight. ‡Diff_3 mo= (body weight of postoperative 3 month-preoperative body weight)/preoperative body weight.
      Fig. 3 Weight change of 4 groups by gender and whether they were treated with chemotherapy. *Diff_1 wk=(body weight of postoperative 1 week-preoperative body weight)/ preoperative body weight. †Diff_6 wk=(body weight of postoperative 6 week-preoperative body weight)/preoperative body weight. ‡Diff_3 mo= (body weight of postoperative 3 month-preoperative body weight)/preoperative body weight.
      Postoperative Weight Changes, Nutritional Status and Clinical Significance of Colorectal Cancer Patients

      Demographic data and clinical characteristics according to whether they were treated with chemotherapy

      Total number of patients or average (N=374) Patients without chemotherapy (N=137) Patients with chemotherapy (N=237) P-value
      Sex 0.599
       Male 231 (61.8%) 87 (63.5%) 144 (60.8%)
       Female 143 (38.2%) 50 (36.5%) 93 (39.2%)
      Age (mean±SD, years) 63.8±11.2 65.6±11.6 62.8±10.8 0.021
      Body mass index (mean±SD, kg/m2) 23.4±3.3 23.7±3.2 23.2±3.4 0.253
      ASA 0.116
       1 180 (48.1%) 59 (43.1%) 121 (51.0%)
       2 183 (48.8%) 71 (51.8%) 112 (47.3%)
       3 11 (2.9%) 7 (5.1%) 4 (1.7%)
      Instant nutrition assessment 0.932
       Good 244 (65.2%) 89 (65.0%) 155 (65.4%)
       Poor 130 (34.8%) 48 (35.0%) 82 (34.6%)
      Location of colorectal cancer 0.195
       Right 130 (34.8%) 45 (32.8%) 85 (35.9%)
       Left 177 (47.3%) 61 (44.5%) 116 (48.9%)
       Rectum 67 (17.9%) 31 (22.7%) 36 (15.2%)
      Method of operation 0.001
       Open 104 (27.8%) 24 (17.5%) 80 (33.8%)
       Laparoscopy 270 (72.2%) 113 (82.5%) 157 (66.2%)
      TNM stage <0.001
       0 13 (3.5%) 13 (9.5%) 0 (0.0%)
       1 77 (20.6%) 77 (56.2%) 0 (0.0%)
       2 98 (26.2%) 34 (24.8%) 64 (27.0%)
       3 135 (36.1%) 11 (8.0%) 124 (52.3%)
       4 51 (13.6%) 2 (1.5%) 49 (20.7%)
      Complication 0.303
       No 328 (87.7%) 117 (85.4%) 211 (89.0%)
       Yes 46 (12.3%) 20 (14.6%) 26 (11.0%)
      Length of stay (mean±SD, days) 10.1±3.9 9.6±3.6 10.3±4.2 0.086
      CEA (ng/mL) 13.2±46.6 3.7±4.2 18.7±57.6 <0.001
       ≤5 253 (67.6%) 111 (81.0%) 142 (59.9%) <0.001
       >5 121 (32.4%) 26 (19.0%) 95 (40.1%)
      Severe weight loss
       Postoperative 1 week 76 (20.3%) 21 (15.3%) 55 (23.2%) 0.068
       Postoperative 6 weeks 138 (36.9%) 42 (30.7%) 96 (40.5%) 0.057
       Postoperative 3 months 87 (23.3%) 23 (16.8%) 64 (27.0%) 0.024
       Postoperative 6 months 32 (8.6%) 8 (5.8%) 24 (10.1%) 0.153

      Nutritional assessment compared with preoperative and postoperative according to whether they were treated with chemotherapy

      Preoperative status Postoperative after 6 months


      Patients without chemotherapy (N=137) Patients with chemotherapy (N=237) P-value Patients without chemotherapy (N=137) Patients with chemotherapy (N=237) P-value
      Lymphocyte 1847±639 1790±608 0.387 1950±662 1759±658 0.007
       <1500/μL 118 (86.1%) 203 (85.7%) 0.899 34 (68.0%) 38 (76.0%) 0.387
       ≥1500/μL 19 (13.9%) 34 (14.3%) 16 (32.0%) 12 (24.0%)
      Albumin 4.1±0.4 4.0±0.5 0.022 4.2±0.4 4.1±0.4 0.007
       <3.5 g/dL 128 (93.4%) 216 (91.1%) 0.432 135 (98.5%) 235 (99.2%) 0.577
       ≥3.5 g/dL 9 (6.6%) 21 (8.9%) 2 (1.5%) 2 (0.8%)
      Hemoglobin 12.9±2.0 12.3±2.1 0.009 13.1±1.6 12.7±1.7 0.043
      Anemia 0.009 0.009
       No 84 (61.3%) 112 (47.3%) 95 (69.3%) 132 (55.7%)
       Yes 28 (38.7%) 125 (52.7%) 42 (30.7%) 105 (44.3%)
      Instant nutrition assessment 0.932 0.021
       Good 88 (65.0%) 155 (65.4%) 101 (73.7%) 147 (62.0%)
       Poor 49 (35.0%) 82 (34.6%) 36 (26.3%) 90 (38.0%)
       1 88 (64.2%) 155 (65.4%) 0.276 101 (73.7%) 147 (62.0%) 0.048
       2 40 (29.2%) 61 (25.7%) 0 (0.0%) 2 (0.8%)
       3 4 (2.9%) 3 (1.3%) 34 (24.8%) 87 (36.7%)
       4 5 (3.7%) 18 (7.6%) 2 (1.5%) 1 (0.4%)

      Nutritional assessment compared with preoperative and postoperative according to patients’ sex and whether they were treated with chemotherapy

      Male patients without chemotherapy (N=87) Female patients without chemotherapy (N=50) Male patients with chemotherapy (N=144) Female patients with chemotherapy (N=93)


      Preoperative 6 months after surgery Preoperative 6 months after surgery Preoperative 6 months after surgery Preoperative 6 months after surgery
      Lymphocyte 1868±670 1935±676 1811±587 1977±643 1828±633 1814±678 1731±565 1674±619
       <1500/μL 59 (67.8%) 63 (72.4%) 34 (68.0%) 38 (76.0%) 98 (68.1%) 96 (66.7%) 60 (64.5%) 52 (55.9%)
       ≥1500/μL 28 (32.2%) 24 (27.6%) 16 (32.0%) 12 (24.0%) 46 (31.9%) 48 (33.3%) 33 (35.5%) 41 (44.1%)
      Albumin 4.2±0.4 4.2±0.3 4.1±0.5 4.2±0.3 4.1±0.4 4.1±0.3 3.9±0.5 4.1±0.3
       <3.5 g/dL 85 (94.3%) 85 (97.7%) 46 (92.0%) 50 (100%) 135 (93.8%) 142 (98.6%) 81 (87.1%) 93 (100%)
       ≥3.5 g/dL 5 (5.7%) 2 (2.3%) 4 (8.0%) 0 (0.0%) 9 (6.3%) 2 (1.4%) 12 (12.9%) 0 (0.0%)
      Hemoglobin 13.6±2.0 13.6±1.5 11.8±1.6 12.2±1.2 13.1±2.1 13.3±1.7 11.2±1.5 11.9±1.2
      Anemia
       No 59 (67.8%) 62 (71.3%) 25 (50.0%) 33 (66.0%) 84 (58.3%) 88 (61.1%) 28 (30.1%) 44 (47.3%)
       Yes 28 (32.2%) 25 (28.7%) 25 (50.0%) 17 (34.0%) 60 (41.7%) 56 (38.9%) 65 (69.9%) 49 (52.7%)
      Instant nutrition assessment grade
       1 57 (65.5%) 63 (72.4%) 31 (62.0%) 38 (76.0%) 97 (67.4%) 95 (66.0%) 58 (62.3%) 52 (55.9%)
       2 25 (28.7%) 22 (25.3%) 15 (30.0%) 12 (24.0%) 38 (26.4%) 2 (1.4%) 23 (24.7%) 0 (0.0%)
       3 2 (2.3%) 0 (0.0%) 3 (4.0%) 0 (0.0%) 1 (0.6%) 46 (31.9%) 2 (2.2%) 41 (44.1%)
       4 3 (3.4%) 2 (2.3%) 3 (4.0%) 0 (0.0%) 8 (5.6%) 1 (0.7%) 10 (10.8%) 0 (0.0%)

      Factors for severe weight loss at 3 months post-surgery after univariate and multivariate analyses.

      Patients with weight loss over -5% of postoperative after 3months

      Univariate analysis Multivariate analysis


      Patients with weight loss over -5% n (%) P Adjusted odds ratio (95% confidence interval) P
      Sex 0.016 0.027
       Female 24/143 (16.8) 1
       Male 64/231 (27.7) 1.83 (1.07~3.13)
      Age 0.677
       <65 years 45/148 (24.5)
       ≥65 years 43/147 (22.6)
      ASA 0.151
       I 36/178 (20.2)
       II and III 52/144 (26.5)
      Body mass index 0.295
       <25 56/255 (22.0)
       ≥25 32/119 (26.9)
      Comorbidity 0.292
       No 35/167 (21.0)
       Yes 53/207 (25.6)
      Location of colorectal cancer 0.096 0.100
       Right and Left 67/307 (21.8) 1
       Rectum 21/67 (31.3) 1.66 (0.91~3.05)
      Instant nutrition assessment 0.508
       Good 60/244 (24.6)
       Poor 28/130 (21.5)
      CEA (ng/mL) 0.510
       ≤5 57/253 (22.5)
       >5 31/121 (25.6)
      Method of operation 0.677
       Open 26/104 (25.0)
       Laparoscopy 62/270 (23.0)
      Chemotherapy 0.019 0.008
       No 23/137 (16.8) 1
       Yes 65/237 (27.4) 2.11 (1.22~3.65)
      Complication 0.022 0.029
       No 71/328 (21.6) 1
       Yes 17/46 (37.0) 2.12 (1.08~4.17)
      Cancer stage 0.202
       Non-advanced 39/188 (20.7)
       Advanced 49/186 (26.3)
      Anemia 0.135
       No 40/196 (20.4)
       Yes 48/178 (27.0)
      Albumin 0.979
       <3.5 g/dL 81/344 (23.5)
       ≥3.5 g/dL 7/30 (23.3)
      Lymphocyte 0.593
       <1500/μL 74/321 (23.1)
       ≥1500/μL 14/53 (23.5)
      Table 1 Demographic data and clinical characteristics according to whether they were treated with chemotherapy

      Table 2 Nutritional assessment compared with preoperative and postoperative according to whether they were treated with chemotherapy

      Table 3 Nutritional assessment compared with preoperative and postoperative according to patients’ sex and whether they were treated with chemotherapy

      Table 4 Factors for severe weight loss at 3 months post-surgery after univariate and multivariate analyses.


      Ann Clin Nutr Metab : Annals of Clinical Nutrition and Metabolism
      Close layer
      TOP