 E-submission
Articles
- Page Path
- HOME > Ann Clin Nutr Metab > Volume 17(1); 2025 > Article
- Original Article Association between decreased dietary intake during hospitalization and long-term weight loss in postoperative gastric cancer patients over 75 years of age: a retrospective cohort study
-
Daiki Tabe1
 , Isao Miyajima1, Akira Tsukada2
 -
Annals of Clinical Nutrition and Metabolism 2025;17(1):75-84.
DOI: https://doi.org/10.15747/ACNM.25.0004
Published online: April 1, 2025
1Department of Clinical Nutrition, Chikamori Hospital, Chikamori Health Care Group, Kochishi, Japan
2Department of Gastroenterological Surgery, Chikamori Hospital, Chikamori Health Care Group, Kochishi, Japan
- Corresponding author: Daiki Tabe email: las.vegas.126026@gmail.com
This article is a secondary publication of an article in Japanese published in the
It was presented at the 59th Academic Conference of the Japanese Society of Surgical Metabolism and Nutrition.
• Received: February 11, 2025 • Revised: March 3, 2025 • Accepted: March 10, 2025
© 2025 Korean Society of Surgical Metabolism and Nutrition · Korean Society for Parenteral and Enteral Nutrition · Asian Society of Surgical Metabolism and Nutrition · Japanese Society for Surgical Metabolism and Nutrition
This is an Open Access article distributed under the terms of the Creative Commons Attribution Non-Commercial License (http://creativecommons.org/licenses/by-nc/4.0), which permits unrestricted non-commercial use, distribution, and reproduction in any medium, provided the original work is properly cited.
- 119 Views
- 7 Download
Abstract
-
Purpose Weight loss following gastrectomy is a significant concern, and maintaining adequate nutrition is necessary, especially given the growing number of older adult patients. This study examined the relationship between postoperative food intake and long-term weight loss in postgastrectomy patients aged ≥75 years.
-
Methods Out of 88 patients who underwent gastrectomy for gastric cancer at our institute, 46 were aged ≥75 years. These patients were divided into two groups: one with an average energy intake exceeding 50% of the basal metabolic rate and one with an intake below 50% of the basal metabolic rate. The percentage change in body weight up to 6 months post-surgery was compared between the groups.
-
Results In the group with higher dietary intake, the rate of weight change at 3 and 6 months postoperatively was lower, and fewer patients received postoperative adjuvant chemotherapy.
-
Conclusion Poor postoperative food intake may serve as a predictor of weight loss up to 3 months following surgery in postgastrectomy patients aged ≥75 years.
Introduction
Weight loss is a critical issue in the continuation of cancer treatment. In gastric cancer specifically, postoperative weight loss has been linked to both the continuation of adjuvant chemotherapy and the rate of postoperative recurrence [1,2]. Therefore, implementing nutritional therapy to control weight loss is crucial during the postoperative period of gastric cancer.
Despite the importance of maintaining nutritional intake after gastric cancer surgery, patients often experience reduced food consumption. Reports indicate that food intake in postoperative gastric cancer patients decreases by 8.9% after pyloric gastrectomy and by 15.6% after total gastrectomy compared to preoperative levels at 1 month after surgery [3]. Furthermore, surgical indications for older adults are expanding due to an aging patient population and advances in perioperative management, resulting in an increasing percentage of patients aged ≥75 years undergoing gastric cancer surgery [4]. It has been reported, however, that gastric cancer patients ≥80 years of age experience greater loss of lean body mass compared to those under 80 [5], underscoring the need for more intensive nutritional therapy in older adult patients.
In terms of nutritional therapy, studies have shown that administering nutritional supplements after gastric cancer surgery can effectively mitigate postoperative weight loss [6]. On the other hand, there are few studies investigating the relationship between energy intake during postoperative hospitalization and long-term weight changes in gastric cancer patients, particularly in older adults. In clinical practice, many older adult patients experience a sustained decrease in food intake during postoperative hospitalization, which often leads to continued weight loss after discharge. As the number of gastric cancer patients aged ≥75 years increases, the ability to predict long-term postoperative weight loss based on early declines in energy intake during hospitalization could facilitate the implementation of early and intensive nutritional therapy.
We conducted a study to clarify the association between reduced energy intake during postoperative hospitalization and long-term weight loss in older adult gastric cancer patients.
Methods
This study received approval from the Ethics Committee of Chikamori Hospital (Approval No. 473, issued on November 24, 2021).
This study was a retrospective cohort study. It was described according to the STROBE statement, which is available at https://www.strobe-statement.org/.
The study was conducted at Chikamori Hospital using patient records from January 2017 to December 2020. Nutritional management followed the clinical pathway (Fig. 1). On the second postoperative day, patients were allowed drinking water; on the third day, they were given a liquid diet (divided meals); on the fourth day, a semi-solid diet (divided meals); on the sixth day, a porridge diet (divided meals); and on the seventh day, a normal diet (divided meals). The energy and protein content of each meal type are shown in Table 1. From postoperative day 1 to day 5, patients received extracellular fluid replacement and a hypotonic electrolyte solution. If oral intake could not be initiated by postoperative day 5, a 7.5% glucose-sweetened amino acid solution was administered, as depicted in Fig. 1.
Out of 88 patients who underwent gastrectomy for gastric cancer at Chikamori Hospital between January 2017 and December 2020, 84 patients (aged 50–96 years) were included. One patient who died in the hospital and three patients whose weight measurement conditions could not be standardized due to maintenance dialysis were excluded. For intergroup comparisons, these 84 subjects were initially divided into two groups: patients aged ≥75 years and those <75 years. Then, among the 46 patients aged ≥75 years, we subdivided them into a “sufficient” group (22 patients) with an average energy intake during hospitalization of at least 50% of the basal energy expenditure (BEE), and a “insufficient” group (24 patients) with an intake below 50% of BEE.
Outcome variables are detailed in the Measurement section below. In the regression analysis, the dependent variable was the percentage change in body weight at 3 and 6 months postoperatively, while the explanatory variables included energy sufficiency relative to BEE and the surgical technique, which reflects differences in the extent of resection.
Since all target subjects were included, there was no selection bias.
Medical records were collected using Nippon Electric Company's MegaOakHR.
Patient background
Data on patient age, sex, preoperative body mass index (BMI), skeletal mass index (SMI), and sarcopenia were collected. SMI was measured using the Inbody S10, and sarcopenia was diagnosed based on the criteria established by the Asian Working Group for Sarcopenia 2019 [7].
Blood test findings
Blood tests, conducted by SRL Inc., assessed preoperative serum albumin (Alb), total lymphocyte count, and C-reactive protein (CRP).
Surgical findings and postoperative course
The surgical technique and approach (laparoscopic or open) were documented. Postoperative complications were classified as grade II or higher according to the Clavien-Dindo system.
Nutritional evaluation
Based on preoperative blood test results, we investigated the Prognostic Nutritional Index (PNI) developed by Onodera et al. [8] and the Glasgow Prognostic Scale with cutoff values of 1.0 mg/dL for serum CRP and 3.5 g/dL for serum Alb, according to Elahi et al. [9].
Weight change
Patients were weighed by a nurse 2 to 3 hours after breakfast, either in their room or in the outpatient examination area. The rate of weight change was calculated using the preoperative weight as the baseline and comparing it to the weight at discharge and at 1, 3, and 6 months post-surgery.
BEE calculation method and energy intake sufficiency ratio
BEE was calculated using the Harris-Benedict equation. Nurses recorded the energy intake from each meal, and the energy values of the main meal and side dishes were determined from these records. The cumulative energy intake from the start of meals until the day before discharge was calculated. This value, combined with the energy intake from intravenous nutrition administered after surgery, was divided by the length of hospital stay (from the first postoperative day to the day before discharge) to derive the sufficiency ratio relative to BEE.
Others
We also examined the incidence and completion rate of postoperative adjuvant chemotherapy following discharge, as well as the rate of patient readmission.
As all eligible patients were included based on the selection criteria, no formal sample size estimation was performed.
Continuous variables are presented as mean±standard deviation. The Mann-Whitney U test, unpaired t-test, and chi-square test were used for comparisons between groups. Multiple regression analysis was performed to identify factors associated with the rate of weight change at 3 and 6 months postoperatively, with energy sufficiency relative to BEE, surgical technique, pathological stage (pStage), and the presence of postoperative adjuvant chemotherapy as independent variables. The analyses were performed using SPSS version 28.0.0.1 (IBM Corp.), and statistical significance was defined as P<0.05.
Results
The subjects and procedures of this study are shown in Fig. 2.
In Study 1, 84 patients were compared, with patients ≥75 years of age versus patients <75 years of age. The older group exhibited a 37% higher prevalence of sarcopenia than the younger group (P=0.061). There were no significant differences in preoperative BMI, PNI, or postoperative dietary intake between the groups. However, at 3 months postoperatively, the older group of patients had lower PNI (P=0.019) and serum Alb levels (P=0.013) (Tables 2, 3).
The weight change was significantly lower in the adults ≥75 years of age (–4.1%±4.7%) than in the younger group (–6.4%±5.0%) at discharge (P=0.029). However, there were no significant differences in the weight change at 1, 3, and 6 months postoperatively (Fig. 3), or in the rate of weight change at 1, 3, and 6 months postoperatively (Fig. 3).
In Study 2, 46 patients aged ≥75 years were divided into a sufficient group (22 patients) and an insufficient group (24 patients). There were no significant differences in patient background, surgical technique, or postoperative course between the groups, although the insufficient group showed a trend toward a higher percentage of advanced cancer (P=0.075) (Table 4).
The mean energy intake in the sufficient group was 769±146 kcal, whereas it was 517±106 kcal in the insufficient group (P<0.001). There was no difference in the duration of intravenous nutrition or the percentage of patients who received nutritional solutions (Table 5).
Preoperative PNI did not differ between the groups; however, at 3 months postoperatively, the insufficient group showed a tendency toward lower PNI (44.9±7.2) compared with the secure group (47.6±3.1, P=0.064). Additionally, serum Alb at 3 months postoperatively was significantly lower in the insufficient group (3.7±0.5 g/dL) than in the secure group (4.0±0.3 g/dL, P=0.013) (Table 6).
There was no significant difference in postoperative weight change between the two groups at discharge and at 1 month. However, at 3 months postoperatively, the insufficient group experienced significantly greater weight loss (–12.9%±7.4%) compared to the secure group (–8.3%±5.7%, P=0.032). Similarly, at 6 months postoperatively, weight loss was –9.5%±6.2% in the secure group versus –14.5%±5.8% in the insufficient group (P=0.018) (Fig. 4).
The number of patients receiving postoperative adjuvant chemotherapy after discharge was significantly higher in the insufficient group (P=0.035), with three patients in the secure group and 10 in the insufficient group. Moreover, 0 (0%) patients in the secure group and three (30%) in the insufficient group completed chemotherapy. Additionally, the readmission rate after discharge was significantly higher in the insufficient group, with 14 patients (58%) compared to six patients (27%) in the secure group (P=0.023).
Multiple regression analysis, with the rate of weight change at 3 and 6 months postoperatively as the dependent variable and energy sufficiency relative to BEE, surgical technique, pStage, and the presence of postoperative adjuvant chemotherapy as independent variables, identified postoperative adjuvant chemotherapy as an independent predictor of weight loss at 6 months postoperatively (Table 7).
Discussion
In Study 1, patients ≥75 years of age exhibited a 37% higher prevalence of sarcopenia (P=0.061) than those <75 years of age and had lower PNI (P=0.019) and serum Alb levels (P=0.013) at 3 months post-surgery. Although weight loss at discharge was lower in the older group (–4.1%±4.7%) than in the younger group (–6.4%±5.0%, P=0.029), weight loss rates became similar thereafter. In Study 2, among older adult patients (≥75 years) divided into sufficient (n=22) and insufficient (n=24) groups, there were no baseline differences, although a trend toward more advanced cancer was observed in the insufficient group (P=0.075). The sufficient group had a higher energy intake (769±146 kcal) than the insufficient group (517±106 kcal, P<0.001). At 3 months postoperatively, the insufficient group had lower serum Alb (P=0.013) and greater weight loss (P=0.032), with these differences persisting at 6 months (P=0.018). Additionally, both adjuvant chemotherapy and readmission rates were higher in the insufficient group (P=0.035 and P=0.023, respectively). Notably, postoperative adjuvant chemotherapy emerged as a predictor of weight loss at 6 months.
First, no significant difference was observed in the percentage of postoperative inpatient energy intake relative to BEE between patients ≥75 and <75 years of age following gastrectomy. Although the rate of weight change at hospital discharge was lower in the older group, the weight change rates at 1, 3, and 6 months postoperatively did not differ between the groups. Moreover, there were no differences in disease background or preoperative nutritional status between the two age groups.
Similarly, the postoperative course was comparable, indicating no significant difference in energy intake or BEE sufficiency. Nevertheless, the rate of weight change at hospital discharge was lower in the older group. This may be attributed to the fact that the actual energy consumption in older adults is lower than the BEE calculated by the Harris-Benedict equation, due to reduced lean body mass and activity levels [10,11].
The study found that the prevalence of sarcopenia was higher among adults ≥75 years of age, who are likely to have diminished physical function and reduced activity levels. This discrepancy between the calculated BEE and actual energy consumption may have contributed to the suppressed weight change rate at hospital discharge. Furthermore, both PNI and serum Alb at 3 months postoperatively were lower in older adults. Previous studies have reported that older patients exhibit less recovery in food intake after an initial decline compared to younger patients [12], and that dietary intake decreases by 5%–10% within 1 to 3 months following gastrectomy, a decline that correlates with weight loss [3]. This finding suggests that it is difficult for late-stage older adult patients to improve their food intake once it has decreased. Weight change was suppressed at the time of discharge, but may have become more prevalent thereafter, leading to a delay in improving nutritional status.
In patients aged ≥75 years who underwent gastrectomy, the rate of weight change from discharge to 1 month postoperatively did not differ between the secure and insufficient groups. However, at 3 and 6 months postoperatively, the secure group exhibited a significantly lower rate of weight change. The lack of difference in early postoperative weight change rates may be explained by observations in colorectal cancer surgery, where early postoperative weight change does not correlate with energy intake [13]. Similar trends were observed in this study. Previous reports indicate that nutritional management using intravenous nutrition can reduce early postoperative weight change in gastric cancer patients when the average energy intake exceeds 1,500 kcal/day [14]. In contrast, the sufficient group in the present study had an average energy intake of 769±146 kcal/day, which is considerably lower, suggesting a minimal effect on the rate of weight change at discharge and at 1 month postoperatively.
Conversely, at 3 and 6 months postoperatively, the secure group exhibited a significantly lower rate of weight change. The predictors identified for weight change at 3 and 6 months were the proportion of energy intake during hospitalization relative to BEE and the presence of postoperative adjuvant chemotherapy, respectively. Older patients often experience a prolonged decline in food intake [12], which may compound the effects of gastrectomy and impact long-term weight change.
Previous studies have reported that early administration of nutritional supplements in the postoperative period can suppress weight change 6 to 8 weeks after gastrectomy [6]. Therefore, focusing on achieving a sufficient energy intake during hospitalization may help mitigate long-term weight loss. In this study, the presence of postoperative adjuvant chemotherapy was identified as a predictor of weight loss at 6 months. It has been previously documented that adjuvant chemotherapy can contribute to postoperative weight loss and low body weight [15,16]. The higher frequency of adjuvant chemotherapy in the group with low dietary intake may have influenced the 6-month weight change rate. Given that adjuvant chemotherapy after gastric cancer surgery is typically recommended for 6 months to 1 year [17], weight change at 6 months postoperatively may be linked to whether patients receive chemotherapy.
At 3 months postoperatively, the sufficient group had higher serum Alb levels; however, no significant difference was observed at 6 months. The lower rate of weight change in the sufficient group up to 3 months postoperatively indicates improved nutritional status. Conversely, between 3 and 6 months postoperatively, the rate of weight change did not differ significantly between the maintenance group (–2.1%±3.8%) and the shortage group (–1.0%±5.5%, P=0.347), suggesting that the nutritional status in the insufficient group may have improved over time, leading to an eventual increase in serum Alb levels at 6 months.
The readmission rate after discharge was lower in the secure group. The differences in post-discharge weight change between the secure and insufficient groups may have contributed to the overall differences in outcomes [18].
Although no difference was found in energy intake during hospitalization or in long-term weight change between younger (<75 years) and older (≥75 years) patients, the percentage of energy intake sufficiency relative to BEE during hospitalization was associated with long-term weight change in older adults. Previous studies have demonstrated that intravenous nutrition and oral nutritional supplements after gastrectomy can reduce early postoperative weight change [6,14]. Furthermore, weight changes within the first month post-gastrectomy have been shown to affect weight changes up to 6 months postoperatively [19], underscoring the importance of early nutritional management, such as prompt initiation of enteral nutrition. Based on our findings, early intervention to optimize energy intake during hospitalization may positively impact long-term weight outcomes in postgastrectomy patients aged ≥75 years.
This study was a single-center, retrospective analysis with a limited patient population. The accuracy of oral energy intake measurements was constrained because nutrition was not strictly enforced, and nutritional intake after discharge was not assessed. Future prospective studies with larger cohorts, standardized nutritional assessments, and interventions both during hospitalization and post-discharge are warranted. Although no significant difference in hospital stay was observed among postgastrectomy patients aged ≥75 years, the group receiving sufficient nutritional support tended to have a longer hospital stay (19.0±25.4 days) compared to the group with insufficient support (12.3±6.0 days). This difference in hospital stay may have influenced weight change rates, as appropriate nutritional management is provided during hospitalization. Nonetheless, our study found a negative correlation between the length of hospital stay and weight change rate at discharge (correlation coefficient, –0.62; P<0.001), with no significant correlation at 1, 3, or 6 months postoperatively. Additionally, previous studies have reported that hospital stay is not associated with weight change at 1 or 6 months postoperatively after gastrectomy [19], suggesting that the effect of hospital stay on long-term weight change is minimal.
Energy intake during postoperative hospitalization did not differ between patients <75 years of age and those ≥75 years of age undergoing gastrectomy. However, in patients aged ≥75 years, the adequacy of energy intake relative to BEE during hospitalization was a predictor of weight change at 3 months postoperatively.
Authors’ contribution
Conceptualization: AT. Methodology/Formal analysis/validation: DT, IM, AT. Project administration: AT. Funding acquisition: Not applicable. Writing – original draft: DT. Writing – review and editing: DT, IM, AT. All authors read and approved the final manuscript.
Conflict of interest
The authors of this manuscript have no conflicts of interest to disclose.
Funding
None.
Data availability
Contact the corresponding author for data availability.
Acknowledgments
None.
Supplementary materials
None.
Fig. 1.

Flow of nutritional management in the clinical pathway of postoperative management. POD, postoperative day.

Fig. 3.

Trends and comparison of weight loss rates between adults ≥75 and <75 years of age. In the older group, the weight loss rate at discharge was significantly lower, but no difference was observed thereafter compared to the younger group. aMann-Whitney U test: <0.05; bt-test without correspondence: <0.05.
Fig. 4.
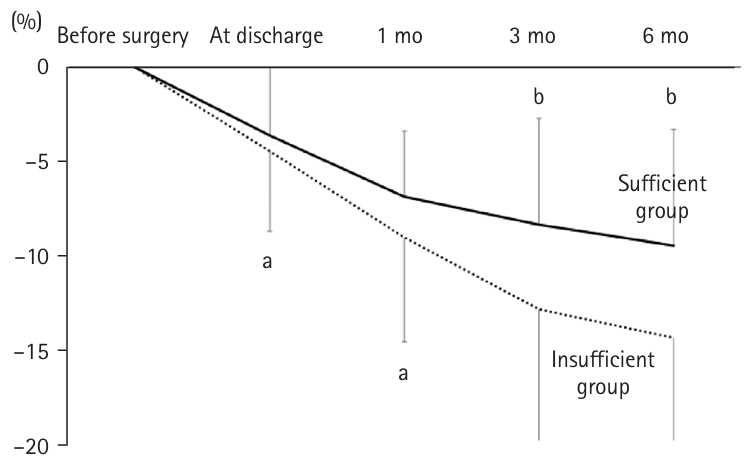
Weight change rates in patients ≥75 years of age after gastrectomy: sufficient group versus insufficient group. In the insufficient group, the weight loss rates at 3 and 6 months post-surgery were significantly greater. aMann-Whitney U test: <0.05; bt-test without correspondence: <0.05.
Table 1.
Nutritional composition of each meal type provided after gastrectomy
| Liquid diet (divided meals) | Semi-solid diet (divided meals) | Full porridge diet (divided meals) | Regular diet (divided meals) | |
|---|---|---|---|---|
| Energy (kcal) | 600 | 750 | 1,400 | 1,600 |
| Protein (g) | 20 | 48 | 60 | 70 |
Table 2.
Comparison of patient backgrounds between adults ≥75 and <75 years of age
Values are presented as number (%) or mean±standard deviation.
BMI, body mass index; SMI, skeletal muscle index; CRP, C-reactive protein; Alb, albumin; TLC, total lymphocyte count; GPS, Glasgow Prognostic Score; PNI, Prognostic Nutritional Index; pStage, pathological stage; DG, distal gastrectomy; PG, proximal gastrectomy, TG, total gastrectomy; BEE, basal energy expenditure.
at-test without correspondence; P<0.05.
Table 3.
Trends in postoperative PNI and Alb in adults ≥75 and <75 years of age
Table 4.
Comparison of patient background and postoperative course between the sufficient group and the insufficient group in patients aged ≥75 years after gastrectomy
Values are presented as mean±standard deviation or number (%).
BMI, body mass index; SMI, skeletal muscle index; CRP, C-reactive protein; Alb, albumin; TLC, total lymphocyte count; GPS, Glasgow Prognostic Score; PNI, Prognostic Nutritional Index; pStage, pathological stage; DG, distal gastrectomy; PG, proximal gastrectomy, TG, total gastrectomy.
aMann-Whitney U test: <0.05.
Table 5.
Energy intake, sufficiency rate relative to basal energy expenditure, duration of intravenous nutrition administration, and proportion of patients receiving nutritional infusion in patients aged 75 years and older after gastrectomy
Table 6.
Postoperative trends in PNI and Alb in the sufficient and insufficient group
Table 7.
Predictive factors of body weight change rate at 3 and 6 months post-surgery
- 1. Aoyama T, Kawabe T, Fujikawa H, Hayashi T, Yamada T, Tsuchida K, et al. Loss of lean body mass as an independent risk factor for continuation of S-1 adjuvant chemotherapy for gastric cancer. Ann Surg Oncol 2015;22:2560-6. ArticlePubMedPDF
- 2. Aoyama T, Yoshikawa T, Maezawa Y, Kano K, Numata M, Hara K, et al. The postoperative lean body mass loss at one month leads to a poor survival in patients with locally advanced gastric cancer. J Cancer 2019;10:2450-6. ArticlePubMedPMC
- 3. Nakazono M, Aoyama T, Hayashi T, Hara K, Segami K, Shimoda Y, et al. Comparison of the dietary intake loss between total and distal gastrectomy for gastric cancer. In Vivo 2021;35:2369-77. ArticlePubMedPMC
- 4. Marubashi S, Takahashi A, Kakeji Y, Hasegawa H, Ueno H, Eguchi S, et al. Surgical outcomes in gastroenterological surgery in Japan: report of the National Clinical Database 2011-2019. Ann Gastroenterol Surg 2021;5:639-58. ArticlePubMedPMCPDF
- 5. Aoyama T, Maezawa Y, Yoshikawa T, Segami K, Kano K, Hayashi T, et al. Comparison of weight and body composition after gastrectomy between elderly and non-elderly patients with gastric cancer. In Vivo 2019;33:221-7. ArticlePubMedPMC
- 6. Imamura H, Nishikawa K, Kishi K, Inoue K, Matsuyama J, Akamaru Y, et al. Effects of an oral elemental nutritional supplement on post-gastrectomy body weight loss in gastric cancer patients: a randomized controlled clinical trial. Ann Surg Oncol 2016;23:2928-35. ArticlePubMedPDF
- 7. Chen LK, Woo J, Assantachai P, Auyeung TW, Chou MY, Iijima K, et al. Asian Working Group for Sarcopenia: 2019 Consensus update on sarcopenia diagnosis and treatment. J Am Med Dir Assoc 2020;21:300-7. ArticlePubMed
- 8. Onodera T, Goseki N, Kosaki G. Prognostic nutritional index in gastrointestinal surgery of malnourished cancer patients. Nihon Geka Gakkai Zasshi 1984;85:1001-5. PubMed
- 9. Elahi MM, McMillan DC, McArdle CS, Angerson WJ, Sattar N. Score based on hypoalbuminemia and elevated C-reactive protein predicts survival in patients with advanced gastrointestinal cancer. Nutr Cancer 2004;48:171-3. ArticlePubMed
- 10. Hunter GR, Weinsier RL, Gower BA, Wetzstein C. Age-related decrease in resting energy expenditure in sedentary white women: effects of regional differences in lean and fat mass. Am J Clin Nutr 2001;73:333-7. ArticlePubMed
- 11. Westerterp KR. Changes in physical activity over the lifespan: impact on body composition and sarcopenic obesity. Obes Rev 2018;19 Suppl 1:8-13. ArticlePubMedPDF
- 12. Roberts SB, Rosenberg I. Nutrition and aging: changes in the regulation of energy metabolism with aging. Physiol Rev 2006;86:651-67. ArticlePubMed
- 13. Yabe H, Tsukamoto M, Takeuchi S, Ito S, Ohmi S, Shiozaki M. Relationship between perioperative weight loss rate and changes in body composition in colorectal cancer patients. Physiother Sci 2018;33:605-9. Article
- 14. Tanaka Y, Hiki N, Kosuge T, Mine S, Nunobe S. A study on the usefulness and safety of a new nutrition-related clinical pathway using peripheral parenteral nutrition containing lipid emulsion, amino acids, and sugars during perioperative gastric cancer patients. J Jpn Soc Parenter Enteral Nutr 2015;30:1137-44.Article
- 15. Yamaoka Y, Fujitani K, Hirao M, Yamamoto K, Miyamoto A, Ikenaga M, et al. Examination of factors associated with low body weight (BMI < 18.5kg/m2) after total gastrectomy. J Jpn Soc Surg 2013;38:726-31.Article
- 16. Aoyama T, Yoshikawa T, Shirai J, Hayashi T, Ogata T, Cho H, et al. Comparison of body weight loss in gastrectomy patients who underwent only surgery and those who underwent surgery followed up with S-1 adjuvant chemotherapy. Gan To Kagaku Ryoho 2012;39:1794-6. PubMed
- 17. Japanese Gastric Cancer Association. Gastric cancer treatment guidelines. 6th ed. Kanahara Publishing; 2021.
- 18. Prado CM, Baracos VE, McCargar LJ, Reiman T, Mourtzakis M, Tonkin K, et al. Sarcopenia as a determinant of chemotherapy toxicity and time to tumor progression in metastatic breast cancer patients receiving capecitabine treatment. Clin Cancer Res 2009;15:2920-6. ArticlePubMedPDF
- 19. Matsui R, Inagi N, Kaneko M, Suzuno C, Hamaguchi Y, Kaneda W, et al. Factors associated with short-term and long-term weight loss after gastric cancer surgery. J Jpn Soc Parenter Enteral Nutr 2017;32:1468-73.Article
References
Figure & Data
REFERENCES
Citations
Citations to this article as recorded by 
 ePub Link
 Cite
CiteAssociation between decreased dietary intake during hospitalization and long-term weight loss in postoperative gastric cancer patients over 75 years of age: a retrospective cohort study
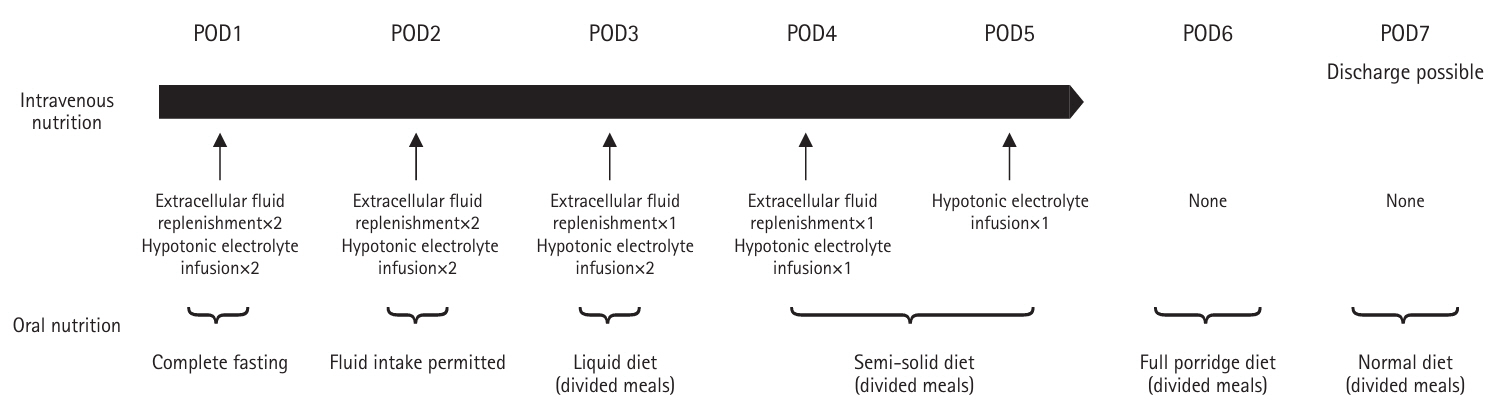
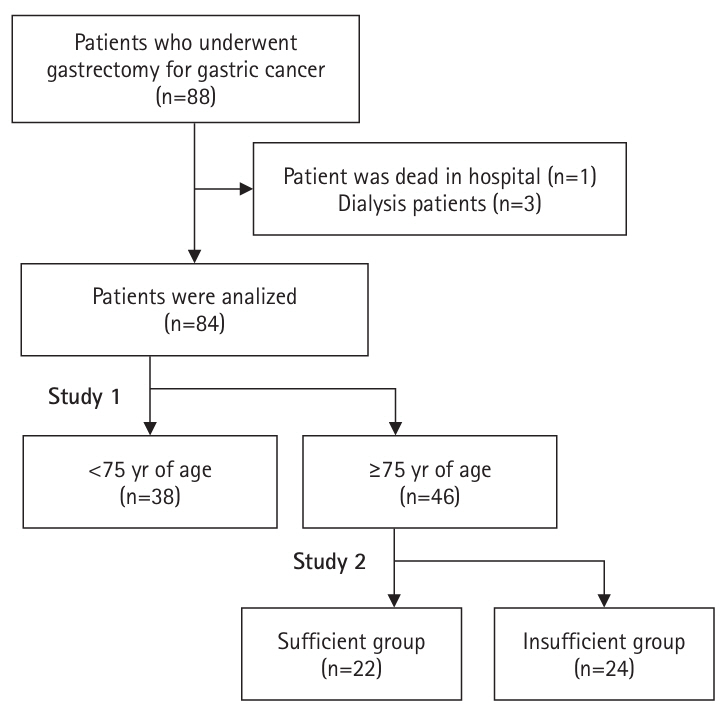
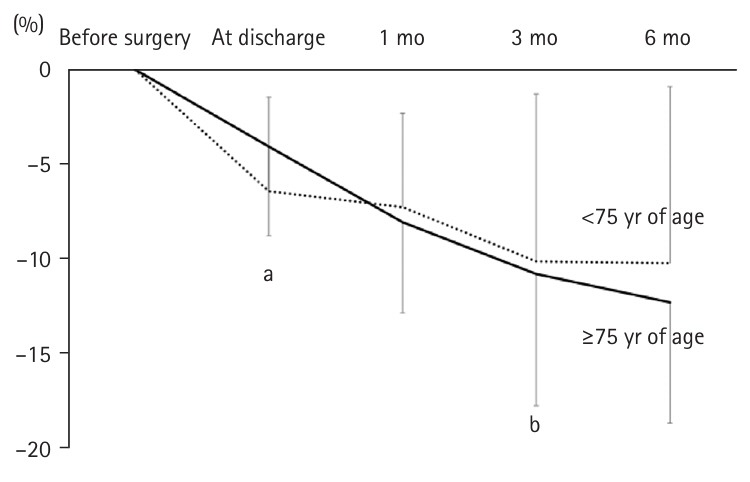

Fig. 1. Flow of nutritional management in the clinical pathway of postoperative management. POD, postoperative day.
Fig. 2. Analysis of subjects and procedures in this study.
Fig. 3. Trends and comparison of weight loss rates between adults ≥75 and <75 years of age. In the older group, the weight loss rate at discharge was significantly lower, but no difference was observed thereafter compared to the younger group. aMann-Whitney U test: <0.05; bt-test without correspondence: <0.05.
Fig. 4. Weight change rates in patients ≥75 years of age after gastrectomy: sufficient group versus insufficient group. In the insufficient group, the weight loss rates at 3 and 6 months post-surgery were significantly greater. aMann-Whitney U test: <0.05; bt-test without correspondence: <0.05.
Fig. 1.
Fig. 2.
Fig. 3.
Fig. 4.
Association between decreased dietary intake during hospitalization and long-term weight loss in postoperative gastric cancer patients over 75 years of age: a retrospective cohort study
| Liquid diet (divided meals) | Semi-solid diet (divided meals) | Full porridge diet (divided meals) | Regular diet (divided meals) | |
|---|---|---|---|---|
| Energy (kcal) | 600 | 750 | 1,400 | 1,600 |
| Protein (g) | 20 | 48 | 60 | 70 |
| Variable | All (n=84) | <75 yr (n=38) | ≥75 yr (n=46) | P-value |
|---|---|---|---|---|
| Male sex | 70 (83) | 34 (89) | 36 (78) | 0.864 |
| Preoperative BMI (kg/m²) | 22.9±3.3 | 22.7±3.4 | 23.1±3.3 | 0.645 |
| Preoperative SMI (kg/m²) | 6.9±1.1 | 7.1±1.2 | 6.8±1.1 | 0.229 |
| Sarcopenia (present) | 24 (29) | 7 (19) | 17 (37) | 0.061 |
| Preoperative CRP (mg/dL) | 0.5±1.1 | 0.4±0.7 | 0.5±1.3 | 0.924 |
| Preoperative Alb (g/dL) | 4.0±0.5 | 4.0±0.5 | 4.0±0.5 | 0.622 |
| Preoperative TLC (10³/μL) | 1.7±0.5 | 1.7±0.5 | 1.6±0.6 | 0.687 |
| Preoperative GPS (0/1/2) | 69/11/4 | 31/7/0 | 38/4/4 | 0.090 |
| Preoperative PNI | 48.4±5.5 | 48.8±5.3 | 48.1±5.8 | 0.540 |
| pStage (I/II/III/IV) | 40/18/18/8 | 17/8/9/4 | 24/10/9/3 | 0.848 |
| Laparoscopic surgery | 44 (52) | 18 (47) | 26 (57) | 0.511 |
| Surgical procedure (DG/PG/TG/others) | 36/7/39/2 | 15/5/18/0 | 21/2/21/2 | 0.206 |
| Postoperative hospital stay (day) | 170±18.4 | 185±18.8 | 155±18.2 | 0.657 |
| Complications | 40 (48) | 17 (45) | 23 (50) | 0.631 |
| Energy intake (kcal) | 657±208 | 682±240 | 637±168 | 0.660 |
| BEE (kcal) | 1,302±188 | 1,354±199 | 1,259±169 | 0.021a |
| Fulfillment rate relative to BEE (%) | 51.2±17.1 | 51.6±21.0 | 50.8±13.4 | 0.615 |
| All (n=84) | <75 yr (n=38) | ≥75 yr (n=46) | P-value | |
|---|---|---|---|---|
| PNI at discharge | 36.6±4.5 | 36.4±4.6 | 36.4±4.5 | 0.314 |
| PNI at 1 mo post-surgery | 45.8±4.5 | 46.4±5.1 | 45.4±4.0 | 0.370 |
| PNI at 3 mo post-surgery | 47.5±5.6 | 49.0±5.2 | 46.2±5.7 | 0.031a |
| PNI at 6 mo post-surgery | 48.1±5.0 | 48.7±5.6 | 47.7±4.5 | 0.391 |
| Alb at discharge (g/dL) | 3.0±0.4 | 3.1±0.4 | 3.0±0.4 | 0.328 |
| Alb at 1 mo post-surgery (g/dL) | 3.8±0.4 | 3.8±0.4 | 3.8±0.4 | 0.411 |
| Alb at 3 mo post-surgery (g/dL) | 3.9±0.4 | 4.0±0.4 | 3.8±0.5 | 0.015a |
| Alb at 6 mo post-surgery (g/dL) | 4.0±0.4 | 4.1±0.4 | 4.0±0.4 | 0.290 |
| Variable | Sufficient group (n=22) | Insufficient group (n=24) | P-value |
|---|---|---|---|
| Age (yr) | 81.0±5.6 | 80.2±3.9 | 0.825 |
| Male sex | 19 (86) | 17 (71) | 0.821 |
| Preoperative BMI (kg/m²) | 23.4±2.9 | 22.8±3.7 | 0.312 |
| Preoperative SMI (kg/m²) | 6.7±1.1 | 6.8±1.1 | 0.927 |
| Weight (kg) | 8 (36) | 17 (38) | 0.936 |
| Preoperative CRP (mg/dL) | 0.6±1.5 | 0.5±1.2 | 0.947 |
| Preoperative Alb (g/dL) | 4.0±0.5 | 4.0±0.4 | 0.625 |
| Preoperative TLC (10³/µL) | 1.6±0.5 | 1.7±0.6 | 0.625 |
| Preoperative GPS(0/1/2) | 18/1/3 | 20/3/1 | 0.364 |
| Preoperative PNI | 48.2±6.0 | 47.9±5.7 | 0.538 |
| pStage (I/II/III/IV) (%)a | 13/2/6/1 | 8/8/4/4 | 0.075 |
| Laparoscopic surgery (present) | 15 (68) | 11 (46) | 0.149 |
| Surgical procedure (DG/PG/TG/other) | 12/2/10/0 | 9/0/11/2 | 0.222 |
| Postoperative hospital stay (day) | 190±25.4 | 123±6.0 | 0.657 |
| Postoperative fasting days (day) | 4.1±6.2 | 3.5±1.9 | 0.299 |
| Complications (present) | 17 (45) | 23 (50) | 0.631 |
| Sufficient group (n=22) | Insufficient group (n=24) | P-value | |
|---|---|---|---|
| Energy intake (kcal/day) | 769±146 | 517±106 | <0.001a |
| Protein intake (g/day) | 30±7 | 19±7 | <0.001a |
| Basal energy expenditure (kcal) | 1,248±176 | 1,270±166 | 0.821 |
| Duration of intravenous nutrition administration (day) | 7.2±6.3 | 7.1±4.4 | 0.738 |
| Number of patients who received nutritional infusion | 5 (23) | 6 (25) | 0.857 |
| Sufficient group (n=22) | Insufficient group (n=24) | P-value | |
|---|---|---|---|
| PNI at discharge | 35.7±4.4 | 37.0±4.6 | 0.397 |
| PNI at 1 mo post-surgery | 45.7±2.9 | 45.3±4.8 | 0.951 |
| PNI at 3 mo post-surgery | 47.6±3.1 | 44.9±7.2 | 0.064 |
| PNI at 6 mo post-surgery | 47.7±3.2 | 48.6±5.7 | 0.934 |
| Alb at discharge (g/dL) | 2.9±0.4 | 3.1±0.3 | 0.439 |
| Alb at 1 mo post-surgery (g/dL) | 3.8±0.3 | 3.7±0.4 | 0.481 |
| Alb at 3 mo post-surgery (g/dL) | 4.0±0.3 | 3.7±0.5 | 0.013a |
| Alb at 6 mo post-surgery (g/dL) | 4.0±0.3 | 4.0±0.4 | 0.770 |
| Univariate analysis | Multivariate analysis | |||||
|---|---|---|---|---|---|---|
| Correlation coefficient | 95% CI | P-value | Correlation coefficient | 95% CI | P-value | |
| Weight change rate at 3 mo post-surgery (%) | ||||||
| Surgical procedure (TG/DG/PG/other) | –0.23 | –0.50 to 0.08 | 0.140 | –0.22 | –3.38 to 0.53 | 0.148 |
| Cancer stage (pStage) | –0.20 | –0.47 to 0.11 | 0.196 | –0.06 | –2.39 to 1.61 | 0.695 |
| Sufficiency rate relative to BEE (%) | 0.40 | 0.11 to 0.62 | 0.009* | 0.37 | 0.03 to 0.35 | 0.025* |
| Presence or absence of postoperative adjuvant chemotherapy | 0.19 | –0.19 to 7.45 | 0.232 | 0.30 | –4.29 to 5.10 | 0.862 |
| Weight change rate at 6 mo post-surgery (%) | ||||||
| Surgical procedure (TG/DG/PG/other) | –0.26 | –0.54 to 0.08 | 0.128 | –0.23 | –3.11 to 0.28 | 0.118 |
| Cancer stage (pStage) | –0.18 | –0.45 to 0.15 | 0.279 | –0.04 | –2.26 to 1.64 | 0.780 |
| Sufficiency rate relative to BEE (%) | 0.34 | 0.01 to 0.60 | 0.042* | 0.18 | –0.07 to 0.34 | 0.250 |
| Presence or absence of postoperative adjuvant chemotherapy | 0.54 | 3.52 to 11.49 | <0.001* | 0.45 | 2.04 to 10.52 | 0.005* |
Table 1. Nutritional composition of each meal type provided after gastrectomy
Table 2. Comparison of patient backgrounds between adults ≥75 and <75 years of age
Values are presented as number (%) or mean±standard deviation. BMI, body mass index; SMI, skeletal muscle index; CRP, C-reactive protein; Alb, albumin; TLC, total lymphocyte count; GPS, Glasgow Prognostic Score; PNI, Prognostic Nutritional Index; pStage, pathological stage; DG, distal gastrectomy; PG, proximal gastrectomy, TG, total gastrectomy; BEE, basal energy expenditure. t-test without correspondence; P<0.05.
Table 3. Trends in postoperative PNI and Alb in adults ≥75 and <75 years of age
Values are presented as mean±standard deviation. PNI, Prognostic Nutritional Index; Alb, albumin. aP<0.05, t-test without correspondence.
Table 4. Comparison of patient background and postoperative course between the sufficient group and the insufficient group in patients aged ≥75 years after gastrectomy
Values are presented as mean±standard deviation or number (%). BMI, body mass index; SMI, skeletal muscle index; CRP, C-reactive protein; Alb, albumin; TLC, total lymphocyte count; GPS, Glasgow Prognostic Score; PNI, Prognostic Nutritional Index; pStage, pathological stage; DG, distal gastrectomy; PG, proximal gastrectomy, TG, total gastrectomy. aMann-Whitney U test: <0.05.
Table 5. Energy intake, sufficiency rate relative to basal energy expenditure, duration of intravenous nutrition administration, and proportion of patients receiving nutritional infusion in patients aged 75 years and older after gastrectomy
Values are presented as mean±standard deviation or number (%). aMann-Whitney U test: <0.05.
Table 6. Postoperative trends in PNI and Alb in the sufficient and insufficient group
Values are presented as mean±standard deviation. PNI, Prognostic Nutritional Index; Alb, albumin. at-test without correspondence: <0.05.
Table 7. Predictive factors of body weight change rate at 3 and 6 months post-surgery
CI, confidecne interval; TG, total gastrectomy; DG, distal gastrectomy; PG, proximal gastrectomy; pStage, pathological stage; BEE, basal energy expenditure. *P<0.05.

