Skip Navigation
Skip to contents

Ann Clin Nutr Metab : Annals of Clinical Nutrition and Metabolism

OPEN ACCESS

Articles

Page Path
HOME > Surgical Metabolism and Nutrition > Volume 10(1); 2019 > Article
ORIGINAL ARTICLE Physiological Change of Serum Bilirubin Level by ω-3 Enriched Parenteral Nutrition Versus ω-3 Free Parenteral Nutrition in Healthy Male Subjects
Mi Rin Lee, M.D., Ph.D.1, Min-Gul Kim, M.D., Ph.D.2,3,4, Jae Do Yang, M.D., Ph.D.1,4, Hong Pil Hwang, M.D., Ph.D.1,4, Yunjeong Kim, Ph.D.3,4, Ji-Young Jeon, Ph.D.3,4, Sungwoo Ahn, M.D.1,4, Hee Chul Yu, M.D., Ph.D.1,4,5
Surgical Metabolism and Nutrition 2019;10(1):20-26.
DOI: https://doi.org/10.18858/smn.2019.10.1.20
Published online: June 30, 2019

Department of Surgery, Chonbuk National University Medical School, Jeonju, Korea

Department of Pharmacology, Chonbuk National University Medical School, Jeonju, Korea

Department of Center for Clinical Pharmacology, Chonbuk National University Hospital, Jeonju, Korea

Department of Research Institute of Clinical Medicine of Chonbuk National University-Biomedical Research Institute of Chonbuk University Hospital, Jeonju, Korea

Department of Research Institute for Endocrine Sciences, Chonbuk National University, Jeonju, Korea

Correspondence to: Hee Chul Yu, Department of Surgery, Chonbuk National University Medical School, 20 Geonji-ro, Deokjin-gu, Jeonju 54907, Korea Tel: +82-63-250-1576, Fax: +82-63-271-6197, E-mail: hcyu@jbnu.ac.kr

This study was supported by JW Pharmaceutical, Corp., Seoul, Republic of Korea.


This article received the academic award in the 23th Fall Conference, Surgical metabolism and Nutrition, 2017.

• Received: April 15, 2019   • Accepted: June 5, 2019

Copyright: © The Korean Society of Surgical Metabolism and Nutrition

This is an open access article distributed under the terms of the Creative Commons Attribution Non-Commercial License (http://creativecommons.org/licenses/by-nc/4.0) which permits unrestricted non-commercial use, distribution, and reproduction in any medium, provided the original work is properly cited.

  • 97 Views
  • 1 Download
prev next
  • Purpose:
    Bilirubin is a biomarker for the diagnosis of liver diseases or bile duct dysfunction. This study assessed the physiological changes in the blood bilirubin level infusing ω-3 enriched parenteral nutrition (PN) and ω-3 free PN in healthy male subjects.
  • Materials and Methods:
    This study was a randomized, open-label, two-treatment, two-way crossover trial. Sixteen subjects were assigned randomly to one of two sequences of the two treatments: ω-3 enriched PN or ω-3 free PN was infused via aperipheral venous catheter for six hours at 3 mL/kg/h. Blood samples were collected every one hour from 0 to 12 hours after starting an intravenous infusion for bilirubin concentrations. The total bilirubin and direct bilirubin concentrations in the blood were analyzed using an enzymatic method.
  • Results:
    The bilirubin concentration in the blood was reduced while infusing the ω-3 enriched PN and ω-3 free PN. When it stopped infusing, the bilirubin concentration was recovered. A similar pattern was observed, but there was a further decline and recovery in ω-3 free PN.
  • Conclusion:
    When ω-3 enriched PN and ω-3 free PN are infused in healthy male subjects, the blood bilirubin level decreasedand there is no difference between the two groups.
Intravenous lipid emulsion (ILEs) are administered through parenteral nutrition (PN), providing an abundant source of non-protein calories, and being indispensable for supplying the requirements of essential fatty acids.[1] Traditionally, the soybean oil – based ILEs have been the standard formula. The soy bean - based emulsions, have caused concern because of the potential adverse effects involving oxidative stress, inflammation, and immune response probably caused by undesirable fatty acid composition and enhanced bile acid excretion. Thus, the emergence of different types of ILEs has been postulated for different clinical situations. New ILEs include other oils such as medium chain triglycerides (MCT) or olive oil which is contained lower polyunsaturated fatty acid (PUFA), so called ω-6. Finally, the third generation ILEs, fish oil is mainly composed of ω-3 PUAFs, especially eicosapentaenoic acid and docosahexaenoic acid providing anti-inflammatory and immunomodulatory effects.[2]
The development of significant hepatic dysfunction is a well-recognized complication associated with ILE administration.[3,4] Though ILE associated liver disease is well established in patients, the mechanisms are unclear and are likely to be multi-factorials. Cholestasis and hyperbilirubinemia result in impaired bile secretion in responsible for inflammatory cytokine.
In infants, especially unbound bilirubin is increased in administration of parenteral nutrition including lipid emulsion lead to bilirubin encephalopathy. Some evidence has suggested that, in pediatric patients, the administration of fish oil - based ILEs, is useful on liver disease.[5] Also, A few studies show that administration of fish oil - based ILEs improve liver function.[6] In a previous report, the switch from soybean oil-based ILE to a fish oil-based ILE in children with cholestasis and dyspli- pidemia was associated with a dramatic improvement in serum triglyceride and reduction of concentration of bilirubin.[7] Also, A lipid emulsion based on ω-3 fatty acids decrease conjugated bilirubin.[8] The exact mechanism of action is unclear.
The effect of fish oil - based ILEs in children with hyperbilirubinemia and adult with liver disease has been studies. However, there is no study about physiological change of serum bilirubin level in healthy adults. Therefore, we assessed the physiological change of serum bilirubin level infusing ω-3 enriched PN and ω-3 free PN in healthy male subjects.
The study was approved by the Institutional Review Board of Chonbuk National University Hospital (Jeonju, Republic of Korea) and was conducted according to the Declaration of Helsinki (IRB: 2014-12-002) for biomedical research involving human subjects and the Guideline for Good Clinical Practice. A detailed explanation of the study was provided, and written informed consent was obtained from all participants prior to screening.
1. Subjects
Healthy male volunteers aged 30∼55 years were enrolled in the study. The volunteers’ health was confirmed by physical examination, measurement of vital signs, and routine laboratory assessments (hematology, chemistry, and urinalysis). Volunteers were excluded if they had participated in another clinical study within 2 months preceding the first dose of study medication. Volunteers were restricted to administrate another drug within 10 days be-fore first study dosing.
2. Study design
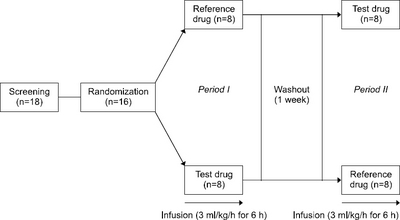
This study was conducted as a randomized, open-label, single-dose, 2-sequence, 2-period crossover trial at the center for clinical pharmacology of Chonbuk National University Hospital. All subjects were randomly assigned to 1 of 2 sequences of 2 treatments. This study was conducted to compare the bilirubin kinetic profiles between ω-3 enriched PN and ω-3 free PN, manufactured JW Pharmaceutical in Korea. The test drug was Winuf peri® as ω-3 enriched PN (dextrose water, amino acid and electrolyte solution, and lipid solvent such as fish oil, soybean oil, olive oil, MCT oil and reference drug was Combiflex lipid peri® as ω-3 free PN (dextrose water, amino acid and electrolyte solution, and soybean oil). Each of the sequence groups consisted of 8 subjects. This descriptive and exploratory study were designed without using power analysis to set sample size.
All subjects were hospitalized at the center for clinical pharmacology on the day before dosing (day 1). At 8 AM on day 1, each subject received the investigational products assigned to his sequence group: intravenous continuous infusion test product or reference product at 3.0 mL/kg flow rate for 6 hours after an overnight fast of at least 10 hours, respectively. Blood samples were collected before dosing and 1, 2, 3, 4, 5, 6, 7, 8, 9, 10, 11, and 12 hours after dosing for both the test and the reference drug for analysis of bilirubin by vanadate oxidation method.
The subjects were discharged on the evening of day 1 (12 hours after dosing). The washout period was 1 week, and the second study period was conducted on the same schedule as the first study period, with the exception for the assignment of the investigational product to be injected to each group (Fig. 1). During the hospitalization periods, smoking, alcohol, heavy exercise, consumption of caffeinated food and beverage and concomitant drugs were not allowed. This trial is registered at https://clinicaltrials.gov/ct2/show/NCT02468713(NCT02468713).
Fig. 1
Study design in healthy Korean male subject.
SMN_10_020_fig_1.jpg
3. Bilirubin concentration assessments
Blood was collected into EDTA tube and centrifuged within 1 hour of collection at 3,000 rpm (1,811 g) for 10 min at 4°C. The separated plasma samples were stored at -70°C until analysis. Direct bilirubin and total bilirubin were analyzed by ADVIA 1200 chemistry system (Siemens Healthcare Diagnostics Inc., Tarrytown, NY, USA) with reagents for ADVIA chemistry direct bilirubin_2 and total bilirubin_2 (Siemens Healthcare Diagnostics Inc.).
When a plasma sample is mixed with the reagent containing the detergent and the vanadate, at pH 3, total bilirubin in the sample is oxidized to biliverdin. This causes the absorbance of yellow, specific to bilirubin, to decrease. Therefore, the total bilirubin concentration in the sample can be obtained by measuring the absorbance before and after the vanadate oxidation. The plasma samples were analyzed after the correlation, regression, and precision studies. Since lipid components can cause analytical interference in the analysis of bilirubin by vanadate oxidation method.
4. Safety and tolerability assessment
Subjects were continuously monitored by investigators throughout the study period. Adverse events (AEs) were identified by asking general health-related questions, such as any discomfort or unexpected experience as well as through self-reporting by the subjects during the study. Physical examinations, routine laboratory assessments (hematology, chemistry, serology and urinalysis), and the measurements of vital signs, such as blood pressure and heart rate, were performed at predefined regular intervals throughout the study.
5. Statistical analyses
Since the total and direct bilirubin are endogenous substances, the plasma concentrations of total and direct bilirubin were corrected for baseline endogenous levels by subtracting the value of pre-dose levels. P-values of total bilirubin and direct bilirubin between ω-3 enriched PN group and ω-3 free PN group were calculated by SAS software (Version 9.4, SAS Institute Inc., Cary, NC, USA).
1. Subject population
From 18 screened subjects, 2 withdrew their unconformable qualification before participating in period 1. Finally, 16 healthy male subjects completed this study. The subjects (with a mean age of 35.1±6.25 years, a mean BMI was 24.3±2.57 kg/m2, a mean height of 171.7±5.01 cm, and a mean weight of 71.6±7.97 kg) were assigned to the relevant sequence group by using a randomization process. There were no significant differences in demographic characteristics between the sequence groups (Table 1).
Table 1
Demographic characteristics of study subjects (mean±SD)
Group A (n=8) Group B (n=8) Total (n=16) P-value1)
Ages (years) 34.8±6.54 35.5±6.37 35.1±6.25 0.820
Height (cm) 170.8±6.58 172.6±2.98 171.7±5.01 0.504
Weight (kg) 69.1±6.00 74.1±9.24 71.6±7.97 0.214
BMI (kg/m2) 23.7±2.24 24.9±2.89 24.3±2.57 0.383

1)independent t-test to test the hypothesis that the difference between the means of two groups is equal to 0.

2. Method development for bilirubin concentration evaluation
Total bilirubin and direct bilirubin concentrations in human plasma by vanadate oxidation method were conducted along with the instructions of Advia 1200 system. The linear range was 0.1∼35.0 mg/dL for total bilirubin and 0.1∼15.0 mg/dL for direct bilirubin, respectively. The vanadate oxidation method displayed an excellent correlation (r=0.99∼1.0) for both total bilirubin and direct bilirubin in all subjects. The CV (%) in plasma samples was 1.3∼3.6% for total bilirubin and 1.2∼1.9% for direct bilirubin. The assay showed no interference with up to 50 mg/dL ascorbic acid, 1000 mg/dL hemoglobin, and 1000 mg/dL triglycerides.
3. Bilirubin kinetic evaluation
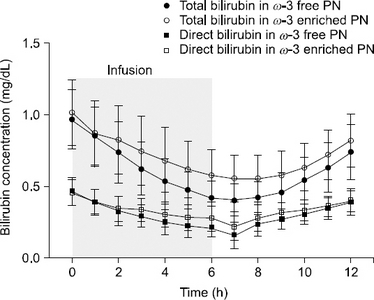
The mean plasma concentration–time profiles of total bilirubin and direct bilirubin are presented in Fig. 2. Total bilirubin and direct bilirubin levels were reduced during the PN, and the level recovered after infusion. The total bilirubin and direct bilirubin decreased significantly when compared with the baseline in ω-3 enriched PN group and ω-3 free PN group. The decrease in ω-3 free PN group showed larger than in ω-3 enriched PN group (Table 2). Maximum reduction of total bilirubin compared to baseline in ω-3 enriched PN and ω-3 free PN group are 0.48±0.12 mg/dL and 0.57±0.13 mg/dL, respectively. Maximum reduction of direct bilirubin compared to baseline in ω-3 enriched PN and ω-3 free PN group are 0.25±0.06 mg/dL and 0.32±0.12 mg/dL, respectively (Table 3).
Table 2
Total bilirubin and direct bilirubin concentration in ω-3 enriched parenteral nutrition and ω-3 free parenteral nutrition (mean±SD)
Time Total bilirubin (mg/dL) P-value1) Direct bilirubin (mg/dL) P-value1)


ω-3 enriched parenteral nutrition ω-3 free parenteral nutrition ω-3 enriched parenteral nutrition ω-3 free parenteral nutrition
0 (Baseline) 1.01±0.23 0.97±0.21 - 0.46±0.09 0.46±0.09 -
1 0.87±0.22* 0.84±0.21 0.6409 0.39±0.09* 0.39±0.09* 0.5495
2 0.82±0.24* 0.74±0.21* 0.3938 0.34±0.09* 0.32±0.10* 0.2889
3 0.75±0.24* 0.62±0.18* 0.0911 0.34±0.08* 0.29±0.08* 0.0227
4 0.68±0.22* 0.54±0.16* 0.0335 0.30±0.09* 0.25±0.09* 0.0053
5 0.62±0.20* 0.47±0.13* 0.0394 0.28±0.09* 0.22±0.08* 0.0041
6 0.57±0.18* 0.42±0.12* 0.0194 0.27±0.09* 0.21±0.06* 0.0022
7 0.55±0.17* 0.40±0.11* 0.0303 0.22±0.10* 0.16±0.09* 0.0014
8 0.55±0.16* 0.42±0.12* 0.0684 0.28±0.09* 0.24±0.08* 0.0300
9 0.58±0.17* 0.45±0.13* 0.1045 0.31±0.08* 0.27±0.07* 0.0244
10 0.63±0.16* 0.54±0.16* 0.3242 0.33±0.07* 0.30±0.07* 0.1090
11 0.72±0.17* 0.63±0.17* 0.3721 0.36±0.07* 0.34±0.07* 0.2649
12 0.82±0.19* 0.74±0.19* 0.5576 0.40±0.08* 0.39±0.09* 0.5315

1)General linear mixed model with Sequence, Treatment, Time, Treatment.

*Time effect as fixed effect and subject effect as random effect.

Table 3
Maximum reduction of total bilirubin and direct bilirubin compared to baseline (mean±SD)
Time Total bilirubin (mg/dL) P-value1) Direct bilirubin (mg/dL) P-value1)


ω-3 enriched parenteral nutrition ω-3 free parenteral nutrition ω-3 enriched parenteral nutrition ω-3 free parenteral nutrition
Maximum reduction 0.48±0.12 0.57± 0.13 0.0038 0.25±0.06 0.32±0.12 0.0060

1)General linear mixed model with Sequence, Treatment, Period effect as fixed effect and sequence nested subject effect as random effect.

Fig. 2
Concentration profile of total bilirubin (TB) and direct bilirubin (DB) in ω-3 enriched parenteral nutrition and ω-3 free parenteral nutrition.
SMN_10_020_fig_2.jpg
4. Safety assessment
One infusion site pain symptom was reported in 1 of 16 subjects infusing ω-3 free PN, and 3 infusion site pain symptoms were reported in 3 of 16 subjects infusing ω-3 enriched parental nutrition. The AE were mild to inter-mediate as they all were resolved without medical intervention. There were no clinically significant findings in the physical examinations, including the changes in vital signs or clinical laboratory evaluations after test and reference product.
The purpose of this study was to evaluate the effects of physiological change of serum bilirubin level by ω-3 enriched PN and ω-3 free PN in healthy male subjects. In this study, there was a decrease in the bilirubin level during the ω-3 enriched PN, and the recovered the value after stopping the nutrition infusion.
Theoretically, parenteral fat emulsions may affect the bilirubin metabolism.[9] First, fat emulsions are capable of binding unconjugated bilirubin in vitro.[10] In vitro, fat particles may displace bilirubin from red blood cell membrane when the bilirubin: albumin molar ratio exceeds 2. Therefore, it is possible that fat particles exert a protective effect against bilirubin encephalopathy. Second, bilirubin as well as fatty acid are bound to serum albumin. In vivo, the high concentrated free fatty acids may encroach on the bilirubin-binding site on the albumin molecule and displace bilirubin from albumin. Liberation of bilirubin is potentially increased the risk of encephalopathy. Third, membrane fluidity maintained by length of hydro-carbon chain, degree of unsaturation, and temperature. If the hydrocarbon chain is short, the fluidity is increased, while if it is long, the fluidity is decreased. Moreover, unsaturated fatty acids are present in cis form, which increases fluidity, thus reducing red blood cell breakdown and reducing bilirubin production.
Lipid components can cause analytical interference in the analysis of bilirubin by vanadate oxidation method, we have analyzed the same sample with HPLC and we obtained the same results in the two methods, it was suggested that there is no error in the method.[11] Bilirubin is a very unstable compound and is poorly soluble, highly photosensitive, and readily oxidized, therefore it is difficult to establish for an accurate method of bilirubin concentrations. Many analytical methods have been developed for measuring bilirubin in serum sample. The most widely used chemical method for determination of the concentrations for total bilirubin and conjugated bilirubin concentration, respectively, in serum is the diazo method, in which the color of azobilirubin formed by the reaction of the porphyrin rings of bilirubin with a diazo compound is spectrophotometrically measured. The vanadate oxidation method has been developed as an alternative method of the diazo method with the limitation that cannot be correctly distinguish indirect bilirubin and direct bilirubin in the quantitatively analyses.[12] In our study, total bilirubin and direct bilirubin concentrations by HPLC method were in perfect correlation with the concentration results analyzed by vanadate oxidation method in all subjects.
This bilirubin basal values and changes in healthy subjects and patients are different, it may be different from the results of this study. The limitation of this study is that it is a small size population. Therefore, it is necessary to study in a large size population and the mechanism for the change of bilirubin. Further studies will be required to investigate the effects of the lipid composition and clinical outcomes in blood for ILE infusion in large sample size and patients.
This is the first study that statistically evaluated changes of the total bilirubin and direct bilirubin along with ω-3 ILE infusion in healthy male subjects. Serum total and direct bilirubin are influenced by both ω-3 enriched and ω-3 free ILE but, there is no difference between two group. The results suggest that two parenteral nutrition solutions can be used safely for contribution of parenteral nutrition.
Both ω-3 enriched and ω-3 free ILE affected blood concentration of bilirubin in healthy Korean male subjects. Parenteral nutrition showed a temporary decrease in total and direct bilirubin in the blood. In conclusion, total and direct bilirubin profiles were not different between ω-3 enriched and ω-3 free ILE infusion.
The authors’ contributions to the manuscript were as follows: Mi Rin Lee, Yunjeong Kim, Ji-Young Jeon, Min-Gul Kim and Hee Chul Yu designed and conducted the research; Min-Gul Kim analyzed the data and Yunjeong Kim wrote the first draft of the manuscript and had primary responsibility for the final content. Hong Pil Hwang, Jae Do Yang, Sungwoo Ahn collected and support for the analyzed of the data; Yunjeong Kim, Ji-Young Jeon, Min-Gul Kim and Hee Chul Yu revised the manuscript and read and approved the final submitted version of the manuscript.
Informed Consent: Informed consent was obtained from all participants.
Human and Animal Rights: The study was performed in accord with the ethical standards of the Declaration of Helsinki (IRB: 2014-12-002).
The authors declare that they have no conflict of interest.
  • 1. Wretlind A. Development of fat emulsions. JPEN J Parenter Enteral Nutr 1981;5:230-5. PubMed
  • 2. Adolph M, Heller AR, Koch T, Koletzko B, Kreymann KG, Krohn K, et al. Working group for developing the guidelines for parenteral nutrition of The German Association for Nutritional Medicine. Lipid emulsions-guidelines on parenteral nutrition, chapter 6. Ger Med Sci 2009;7:Doc22.PubMedPMC
  • 3. Piper SN, Schade I, Beschmann RB, Maleck WH, Boldt J, Röhm KD. Hepatocellular integrity after parenteral nutrition: comparison of a fish-oil-containing lipid emulsion with an olive-soybean oil-based lipid emulsion. Eur J Anaesthesiol 2009;26:1076-82. ArticlePubMed
  • 4. Nanji AA, Anderson FH. Sensitivity and specificity of liver function tests in the detection of parenteral nutrition-associated cholestasis. JPEN J Parenter Enteral Nutr 1985;9:307-8. ArticlePubMed
  • 5. Smithers LG, Gibson RA, McPhee A, Makrides M. Effect of long-chain polyunsaturated fatty acid supplementation of pre-term infants on disease risk and neurodevelopment: a systematic review of randomized controlled trials. Am J Clin Nutr 2008;87:912-20. ArticlePubMed
  • 6. Clayton PT, Bowron A, Mills KA, Massoud A, Casteels M, Milla PJ. Phytosterolemia in children with parenteral nutrition-associated cholestatic liver disease. Gastroenterology 1993;105:1806-13. ArticlePubMed
  • 7. Le HD, de Meijer VE, Robinson EM, Zurakowski D, Potemkin AK, Arsenault DA, et al. Parenteral fish-oil-based lipid emulsion improves fatty acid profiles and lipids in parenteral nutrition-dependent children. Am J Clin Nutr 2011;94:749-58. ArticlePubMed
  • 8. Triana Junco M, García Vázquez N, Zozaya C, Ybarra Zabala M, Abrams S, García de Lorenzo A, et al. An exclusively based parenteral fish-oil emulsion reverses cholestasis. Nutr Hosp 2014;31:514-6. PubMed
  • 9. Brans YW, Ritter DA, Kenny JD, Andrew DS, Dutton EB, Carrillo DW. Influence of intravenous fat emulsion on serum bilirubin in very low birthweight neonates. Arch Dis Child 1987;62:156-60. ArticlePubMedPMC
  • 10. Andrew G, Chan G, Schiff D. Lipid metabolism in the neonate. II. The effect of Intralipid on bilirubin binding in vitro and in vivo. J Pediatr 1976;88:279-84. PubMed
  • 11. Osawa S, Sugo S, Yoshida T, Yamaoka T, Nomura F. An assay for separating and quantifying four bilirubin fractions in un-treated human serum using isocratic high-performance liquid chromatography. Clin Chim Acta 2006;366:146-55. ArticlePubMed
  • 12. Morimoto Y, Ishihara T, Takayama M, Kaito M, Adachi Y. Novel assay for measuring serum conjugated bilirubin and its clinical relevance. J Clin Lab Anal 2000;14:27-31. ArticlePubMedPMC

Figure & Data

REFERENCES

    Citations

    Citations to this article as recorded by  

      • ePub LinkePub Link
      • Cite
        CITE
        export Copy Download
        Close
        Download Citation
        Download a citation file in RIS format that can be imported by all major citation management software, including EndNote, ProCite, RefWorks, and Reference Manager.

        Format:
        • RIS — For EndNote, ProCite, RefWorks, and most other reference management software
        • BibTeX — For JabRef, BibDesk, and other BibTeX-specific software
        Include:
        • Citation for the content below
        Physiological Change of Serum Bilirubin Level by ω-3 Enriched Parenteral Nutrition Versus ω-3 Free Parenteral Nutrition in Healthy Male Subjects
        Ann Clin Nutr Metab. 2019;10(1):20-26.   Published online June 30, 2019
        Close
      • XML DownloadXML Download
      Figure
      • 0
      • 1
      Physiological Change of Serum Bilirubin Level by ω-3 Enriched Parenteral Nutrition Versus ω-3 Free Parenteral Nutrition in Healthy Male Subjects
      Image Image
      Fig. 1 Study design in healthy Korean male subject.
      Fig. 2 Concentration profile of total bilirubin (TB) and direct bilirubin (DB) in ω-3 enriched parenteral nutrition and ω-3 free parenteral nutrition.
      Physiological Change of Serum Bilirubin Level by ω-3 Enriched Parenteral Nutrition Versus ω-3 Free Parenteral Nutrition in Healthy Male Subjects

      Demographic characteristics of study subjects (mean±SD)

      Group A (n=8) Group B (n=8) Total (n=16) P-value1)
      Ages (years) 34.8±6.54 35.5±6.37 35.1±6.25 0.820
      Height (cm) 170.8±6.58 172.6±2.98 171.7±5.01 0.504
      Weight (kg) 69.1±6.00 74.1±9.24 71.6±7.97 0.214
      BMI (kg/m2) 23.7±2.24 24.9±2.89 24.3±2.57 0.383

      1)independent t-test to test the hypothesis that the difference between the means of two groups is equal to 0.

      Total bilirubin and direct bilirubin concentration in ω-3 enriched parenteral nutrition and ω-3 free parenteral nutrition (mean±SD)

      Time Total bilirubin (mg/dL) P-value1) Direct bilirubin (mg/dL) P-value1)


      ω-3 enriched parenteral nutrition ω-3 free parenteral nutrition ω-3 enriched parenteral nutrition ω-3 free parenteral nutrition
      0 (Baseline) 1.01±0.23 0.97±0.21 - 0.46±0.09 0.46±0.09 -
      1 0.87±0.22* 0.84±0.21 0.6409 0.39±0.09* 0.39±0.09* 0.5495
      2 0.82±0.24* 0.74±0.21* 0.3938 0.34±0.09* 0.32±0.10* 0.2889
      3 0.75±0.24* 0.62±0.18* 0.0911 0.34±0.08* 0.29±0.08* 0.0227
      4 0.68±0.22* 0.54±0.16* 0.0335 0.30±0.09* 0.25±0.09* 0.0053
      5 0.62±0.20* 0.47±0.13* 0.0394 0.28±0.09* 0.22±0.08* 0.0041
      6 0.57±0.18* 0.42±0.12* 0.0194 0.27±0.09* 0.21±0.06* 0.0022
      7 0.55±0.17* 0.40±0.11* 0.0303 0.22±0.10* 0.16±0.09* 0.0014
      8 0.55±0.16* 0.42±0.12* 0.0684 0.28±0.09* 0.24±0.08* 0.0300
      9 0.58±0.17* 0.45±0.13* 0.1045 0.31±0.08* 0.27±0.07* 0.0244
      10 0.63±0.16* 0.54±0.16* 0.3242 0.33±0.07* 0.30±0.07* 0.1090
      11 0.72±0.17* 0.63±0.17* 0.3721 0.36±0.07* 0.34±0.07* 0.2649
      12 0.82±0.19* 0.74±0.19* 0.5576 0.40±0.08* 0.39±0.09* 0.5315

      1)General linear mixed model with Sequence, Treatment, Time, Treatment.

      *Time effect as fixed effect and subject effect as random effect.

      Maximum reduction of total bilirubin and direct bilirubin compared to baseline (mean±SD)

      Time Total bilirubin (mg/dL) P-value1) Direct bilirubin (mg/dL) P-value1)


      ω-3 enriched parenteral nutrition ω-3 free parenteral nutrition ω-3 enriched parenteral nutrition ω-3 free parenteral nutrition
      Maximum reduction 0.48±0.12 0.57± 0.13 0.0038 0.25±0.06 0.32±0.12 0.0060

      1)General linear mixed model with Sequence, Treatment, Period effect as fixed effect and sequence nested subject effect as random effect.

      Table 1 Demographic characteristics of study subjects (mean±SD)

      independent t-test to test the hypothesis that the difference between the means of two groups is equal to 0.

      Table 2 Total bilirubin and direct bilirubin concentration in ω-3 enriched parenteral nutrition and ω-3 free parenteral nutrition (mean±SD)

      General linear mixed model with Sequence, Treatment, Time, Treatment.

      Time effect as fixed effect and subject effect as random effect.

      Table 3 Maximum reduction of total bilirubin and direct bilirubin compared to baseline (mean±SD)

      General linear mixed model with Sequence, Treatment, Period effect as fixed effect and sequence nested subject effect as random effect.


      Ann Clin Nutr Metab : Annals of Clinical Nutrition and Metabolism
      Close layer
      TOP