 E-submission
Indexed in:
Scopus, KCI, KoreaMed
Scopus, KCI, KoreaMed

Articles
- Page Path
- HOME > Ann Clin Nutr Metab > Volume 17(3); 2025 > Article
- Original Article Preprocedural prognostic nutritional index predicts early gastrointestinal symptoms after percutaneous endoscopic gastrostomy or percutaneous radiologic gastrostomy in Korea: a retrospective cohort study
-
Yoonhong Kim1,*
 , Jee Young Lee2,*, Yeajin Moon1, Seung Hun Lee1, Kyung Won Seo1, Ki Hyun Kim1
 -
Annals of Clinical Nutrition and Metabolism 2025;17(3):196-202.
DOI: https://doi.org/10.15747/ACNM.25.0032
Published online: December 1, 2025
1Department of Surgery, Kosin University College of Medicine, Busan, Korea
2Nutrition Support Team, Department of Nursing, Kosin University Gospel Hospital, Busan, Korea
- Corresponding author: Ki Hyun Kim e-mail: linus.kkh@gmail.com
Yoonhong Kim and Jee Young Lee contributed equally as co-first authors.
• Received: August 25, 2025 • Revised: November 8, 2025 • Accepted: November 10, 2025
© 2025 The Korean Society of Surgical Metabolism and Nutrition · The Korean Society for Parenteral and Enteral Nutrition · Asian Society of Surgical Metabolism and Nutrition
This is an Open Access article distributed under the terms of the Creative Commons Attribution Non-Commercial License (http://creativecommons.org/licenses/by-nc/4.0), which permits unrestricted non-commercial use, distribution, and reproduction in any medium, provided the original work is properly cited.
- 1,951 Views
- 31 Download
- 1 Crossref
Abstract
-
Purpose The prognostic nutritional index (PNI) reflects immunonutritional status and is a well-established predictor of surgical outcomes. Although its association with post-gastrostomy mortality has been documented, its relationship with early gastrointestinal (GI) symptoms remains unclear. This study aimed to evaluate whether the preprocedural PNI predicts early GI symptoms following percutaneous gastrostomy, including percutaneous endoscopic gastrostomy (PEG) and percutaneous radiologic gastrostomy (PRG).
-
Methods This retrospective study included 71 adults who underwent PEG or PRG. Early GI symptoms, such as nausea, vomiting, and diarrhea, occurring within 7 days were recorded. The preprocedural PNI, neutrophil-to-lymphocyte ratio (NLR), and the C-reactive protein (CRP)-to-albumin ratio were analyzed using logistic regression to identify predictors. Receiver operating characteristic (ROC) analysis was performed to assess the PNI’s discriminative performance.
-
Results Early GI symptoms occurred in 21 of 71 patients (29.6%). In univariate analysis, the PNI (P=0.009) and CRP-to-albumin ratio (P=0.018) were significant predictors, whereas NLR was not (P=0.125). After adjustment for potential confounders, including age, sex, body mass index, and NLR, the PNI remained an independent predictor of early GI symptoms (adjusted odds ratio, 0.90; 95% confidence interval, 0.83–0.98; P=0.021). ROC analysis for the PNI produced an area under the curve of 0.696, with an optimal cutoff value of 41.3 (sensitivity 70.6%, specificity 66.7%).
-
Conclusion A lower preprocedural PNI is independently associated with the development of early GI symptoms after gastrostomy. The PNI may serve as a practical screening tool to identify high-risk patients who could benefit from preemptive nutritional optimization.
Graphical abstract
Introduction
Malnutrition and systemic inflammation are established risk factors for adverse clinical outcomes following gastrostomy, including perforation, infection, and delayed recovery [1]. The prognostic nutritional index (PNI), which is calculated from serum albumin and lymphocyte count, provides an integrated assessment of nutritional and immune status. Originally developed to predict postoperative complications in gastrointestinal (GI) surgery, the PNI has since been validated as a prognostic marker across various clinical scenarios, including GI and oncologic diseases and sepsis [2].
Percutaneous endoscopic gastrostomy (PEG) and percutaneous radiologic gastrostomy (PRG) are established methods for providing enteral nutrition to patients with prolonged swallowing impairment, commonly resulting from stroke, malignancy, or structural obstruction. Although major complications of PEG and PRG are relatively uncommon, early GI symptoms—including nausea, vomiting, bloating, and dyspepsia—are frequently observed and can lead to reduced oral intake, feeding intolerance, and, in severe cases, hospitalization [3,4]. Identifying preprocedural predictors of these symptoms may enable personalized nutritional strategies and reduce morbidity. Although the PNI has been studied as a prognostic factor for early mortality after PEG, with lower values (<37) associated with increased 30-day mortality [2], its role in predicting early GI symptoms independent of mortality has not yet been clarified. Because early GI symptoms may share underlying mechanisms related to impaired immune-nutritional status, it is reasonable to hypothesize that lower PNI values increase susceptibility to early GI complications.
This study sought to determine whether the preprocedural PNI is an independent predictor of early GI symptoms following PEG or PRG. We also evaluated conventional inflammatory markers, including the neutrophil-to-lymphocyte ratio (NLR), to determine whether the PNI offers additional predictive value beyond established indices. We hypothesized that patients with PNI values below a clinically defined cutoff would face an increased risk of early GI symptoms and that the PNI would demonstrate satisfactory discriminative performance based on receiver operating characteristic (ROC) curve analysis.
Methods
This study received approval from the Institutional Review Board (IRB) of Kosin University Gospel Hospital (No. KUGH-2025-07-016) and was conducted in accordance with the principles outlined in the Declaration of Helsinki. Because of the retrospective study design and the use of anonymized data, the IRB waived the requirement for informed consent.
This study is a retrospective observational analysis. It was described in accordance with the Strengthening the Reporting of Observational Studies in Epidemiology (STROBE) guidelines [5].
Electronic medical records were reviewed for patients treated between March 2023 and May 2025 at Kosin University Gospel Hospital in Busan, Korea.
The study population comprised adult patients (aged ≥18 years) who were evaluated by the nutrition support team for postprocedural nutritional care after undergoing PEG or PRG at Kosin University Gospel Hospital between March 2023 and May 2025.
The primary clinical indication for gastrostomy at our institution was the inability to maintain adequate oral nutritional intake. PEG was the preferred approach for gastrostomy placement, whereas PRG was chosen when endoscopic access to the stomach was technically difficult, such as in cases of severe pharyngeal or esophageal stenosis or complex head and neck anatomy. Eligibility criteria required complete preprocedural laboratory data and sufficient clinical follow-up to determine the presence of early GI symptoms. Early GI symptoms were defined as the onset of nausea, vomiting, diarrhea, or abdominal discomfort within 7 days following PEG or PRG, as documented in the electronic medical records. Patients were stratified into two groups based on whether early GI symptoms occurred.
The primary outcome (dependent variable) was the occurrence of early GI symptoms within seven days after gastrostomy. The primary exposure (predictor) was the PNI. Additional inflammatory and nutritional markers included the NLR, C-reactive protein (CRP)-to-albumin ratio, serum albumin, absolute lymphocyte count, and absolute neutrophil count. All variables were obtained from the same preprocedural laboratory panel. Demographic and clinical characteristics, including age, sex, and body mass index (BMI), were also collected.
The PNI was calculated as follows:
PNI=[10×serum albumin (g/dL)] + [0.005×total lymphocyte count (/mm3)].
Additional inflammatory indices included the NLR [6] as well as the CRP-to-albumin ratio [7], both of which were derived from preprocedural laboratory parameters.
To minimize selection bias, all consecutive adult patients (≥18 years) evaluated for and undergoing PEG or PRG during the study period were included, irrespective of clinical indication. Eligibility criteria, specifically the requirement for complete preprocedural laboratory data and documentation sufficient to establish the outcome, were applied consistently. Basic demographics and procedure types were compared between included and excluded patients to assess potential differential inclusion.
This retrospective cohort included all eligible patients during the study period; therefore, no a priori sample size calculation was performed. The final analytic cohort consisted of 71 patients, of whom 21 (29.6%) developed early GI symptoms. Given this event count, we prespecified a parsimonious primary multivariable model to comply with events-per-variable recommendations and reduce the risk of overfitting. Model complexity was further limited by excluding collinear variables and performing sensitivity analyses with reduced covariate sets. Effect estimates are presented with 95% confidence intervals to convey precision and support cautious interpretation consistent with the available sample size.
Patients were classified according to the presence or absence of early GI symptoms. Continuous variables are reported as mean±standard deviation, and comparisons were conducted using the Student t test. Categorical variables are presented as counts and percentages, and the chi-square test was used for group comparisons. Univariable and multivariable logistic regression analyses were performed to identify predictors of early GI symptoms. All clinically relevant variables (age, sex, BMI, PNI, and NLR) were included in the multivariable model regardless of univariable significance. ROC curve analysis was used to evaluate the predictive performance of the PNI, and the optimal cutoff value was identified using the Youden index. All statistical analyses were conducted using R software (version 4.2.2, The R Foundation for Statistical Computing). Statistical significance was defined as a P-value <0.05.
Results
A total of 71 patients who underwent gastrostomy were included in this retrospective study. Early GI symptoms developed in 21 patients (29.6%), while 50 patients (70.4%) showed no symptoms. Baseline demographic characteristics, including age (65.1±14.6 years vs. 68.0±11.0 years, P=0.356) and sex (male: 70.0% vs. 81.0%, P=0.369), did not differ significantly between the no GI symptoms and GI symptoms groups. Similarly, BMI was comparable between the two groups (19.6±2.7 kg/m2 vs. 19.8±3.4 kg/m2, P=0.814). However, the PNI was significantly lower in the GI symptoms group compared to the no GI symptoms group (40.3±7.9 vs. 45.6±6.9, P=0.011). Regarding clinical outcomes, patients who experienced early GI symptoms had a significantly longer post-procedure length of stay (LOS) than those without symptoms (35.8±5.1 days vs. 12.7±2.3 days, P<0.001) (Table 1).
Table 2 presents the results of the univariable and multivariable logistic regression analyses identifying factors associated with early GI symptoms. In the univariable analysis, a lower PNI was significantly associated with an increased risk of early GI symptoms (odds ratio [OR], 0.90; 95% confidence interval [CI], 0.83–0.97; P=0.009). The CRP-to-albumin ratio also demonstrated a significant association with the outcome (OR, 1.40; 95% CI, 1.06–1.85; P=0.018). Other variables, including age, BMI, sex, and the NLR, were not significant predictors (P>0.05). In the multivariable analysis adjusted for age, BMI, sex, and NLR, the PNI remained an independent significant predictor of early GI symptoms (adjusted OR, 0.90; 95% CI, 0.83–0.98; P=0.021). The CRP-to-albumin ratio was excluded from the multivariable model to avoid potential multicollinearity. No other variables showed statistical significance in the multivariable model.
To identify the specific components contributing to the observed associations, we performed separate univariate analyses of the constituent variables of the PNI and NLR. The results are presented in Table 3. This analysis showed that the significant univariate association of the PNI was primarily attributable to the serum albumin component (OR, 0.27; 95% CI, 0.09–0.76; P=0.014). The other components, including absolute lymphocyte count (P=0.083) and absolute neutrophil count (P=0.970), were not significantly associated with early GI symptoms.
ROC curve analysis was conducted to determine the optimal PNI cutoff value for predicting early GI symptoms. Using the Youden index, the optimal cutoff was identified as 41.3. At this threshold, the PNI yielded an area under the curve (AUC) of 0.696, with a sensitivity of 70.6% and specificity of 66.7% (P=0.005) (Fig. 1).
Discussion
This retrospective analysis of patients who underwent percutaneous endoscopic or radiologic gastrostomy indicates that a lower preprocedural PNI is significantly associated with the development of early GI symptoms, such as nausea, vomiting, and abdominal discomfort, within 7 days of tube placement. Notably, after adjusting for potential confounders, including age, BMI, sex, and NLR, the PNI remained an independent predictor of early GI intolerance (adjusted OR, 0.90; 95% CI, 0.83–0.98; P=0.021) (Table 2).
ROC curve analysis further supported this relationship, demonstrating fair discriminative performance (AUC=0.696) with an optimal cutoff value of 41.3 (Fig. 1). The clinical significance of early GI symptoms is underscored by their association with prolonged hospitalization. Our findings confirmed that patients who developed these symptoms experienced substantially longer post-procedure LOS.
These results highlight that early GI symptoms represent more than mild postoperative discomfort; rather, they constitute a clinically meaningful complication that increases healthcare utilization. This also clarifies our methodological decision to treat LOS as an outcome secondary to the development of GI symptoms rather than as a baseline predictor. The PNI is a widely recognized composite score integrating serum albumin and lymphocyte count and was originally developed to predict surgical outcomes in GI cancer patients [8]. Since then, the PNI has gained broad acceptance as a prognostic biomarker across diverse clinical domains, including oncology, frailty assessment, and critical care [9-12]. Of particular relevance, Adachi et al. [2] demonstrated that a PNI below 37 was independently associated with 30-day mortality in patients receiving PEG. Building upon these findings, our study shows for the first time that the PNI also predicts early, non-fatal but clinically significant GI symptoms. This extends the utility of the PNI beyond long-term prognostication and highlights its role in assessing short-term procedural tolerance and immediate care quality.
The biological plausibility of this association is supported by known pathophysiological mechanisms. Malnutrition and impaired immune function, characteristic of lower PNI values, contribute to mucosal atrophy, delayed gastric emptying, and heightened visceral sensitivity—all factors that predispose patients to GI discomfort following gastrostomy [13]. Furthermore, hypoalbuminemia may affect fluid distribution and drug pharmacokinetics, potentially exacerbating GI intolerance [14].
Regarding systemic inflammatory markers, NLR did not demonstrate a significant association with early GI symptoms (P=0.170). In contrast, the CRP-to-albumin ratio showed a significant association with early GI symptoms (OR, 1.40; 95% CI, 1.06–1.85; P=0.018). These findings suggest that the integrated immunonutritional assessment captured by the PNI may provide superior predictive value compared with isolated inflammatory markers.
From a clinical perspective, routine evaluation of the PNI before PEG or PRG placement may assist in identifying patients at elevated risk. Individuals with a PNI ≤41.3 may benefit from tailored preprocedural strategies, including focused nutritional supplementation, albumin optimization, or preventive administration of prokinetic agents, to reduce symptom severity and enhance tolerance to enteral feeding. Such strategies may be especially valuable for older or chronically ill individuals who frequently exhibit compromised immunity and reduced GI resilience [15,16].
Despite the importance of these findings, several limitations warrant consideration. First, as a retrospective single-center analysis, the results may not be widely generalizable and are vulnerable to potential selection or documentation biases. Second, early GI symptoms were identified through electronic medical records rather than standardized patient-reported outcome measures. This method may introduce subjectivity and could lead to underreporting or inconsistent documentation, as symptom identification depended on clinician documentation rather than structured assessment tools. Such variability may result in misclassification bias and may underestimate the true incidence of early GI symptoms. Third, the relatively small sample size limited our ability to conduct subgroup analyses according to gastrostomy type (PEG vs. PRG), procedural details, or underlying clinical comorbidities.
Future studies should include prospective, multicenter cohorts employing validated symptom assessment instruments to evaluate the predictive value of the PNI more precisely in this setting. Randomized controlled trials are also needed to determine whether PNI-guided nutritional interventions can effectively mitigate GI intolerance and improve post-procedure outcomes. Additionally, incorporating the PNI into comprehensive risk prediction models—potentially enhanced by artificial intelligence or machine learning—may further refine preprocedural planning and risk stratification for patients identified as high risk [17].
In conclusion, this study demonstrates that a low preprocedural PNI is a strong and independent predictor of early GI symptoms following gastrostomy. Because the PNI reflects both nutritional status and systemic inflammation, it serves as a simple and clinically valuable biomarker. Assessing the PNI prior to gastrostomy may help identify high-risk patients who could benefit from peri-procedural nutritional optimization to reduce complications.
Authors’ contribution
Conceptualization: JYL. Data curation: YK, YM. Methodology/formal analysis/validation: YM, SHL. Project administration: KHK. Writing–original draft: YK. JYL. Writing–review & editing: YM, SHL, KWS, KHK. All authors read and approved the final manuscript.
Conflict of interest
The authors of this manuscript have no conflicts of interest to disclose.
Funding
None.
Data availability
Contact the corresponding author for data availability.
Acknowledgments
None.
Supplementary materials
None.
Fig. 1.

Results of the receiver operating characteristic curve analysis for prognostic nutritional index. The optimal cutoff value was determined using the Youden index. AUC, area under the curve.

Table 1.
Baseline characteristics according to early GI symptoms
Comparison of demographic and clinical characteristics between patients with and without early GI symptoms following PEG/PRG.
GI, gastrointestinal; SD, standard deviation; BMI, body mass index; PEG, percutaneous endoscopic gastrostomy; PRG, percutaneous radiologic gastrostomy; LOS, length of stay; PNI, prognostic nutritional index; NLR, neutrophil-to-lymphocyte ratio.
P-values were determined using Student t test or chi-square test, as applicable.
Table 2.
Univariable and multivariable logistic regression analyses for predicting early gastrointestinal symptoms
The multivariate logistic regression model included variables considered clinically fundamental or those showing a strong trend in univariate analysis (e.g., age, BMI, PNI). Variables such as serum albumin, HS-CRP, and CRP-to-albumin ratio were excluded from the final multivariate model—despite their univariate significance—to avoid multicollinearity. This is because PNI and the CRP-to-albumin ratio are composite indices calculated from serum albumin and/or CRP, leading to statistical interference when included simultaneously. NLR was also excluded due to its lack of significant association in the univariate analysis.
OR, odds ratio; CI, confidence interval; BMI, body mass index; PNI, prognostic nutritional index; NLR, neutrophil-to-lymphocyte ratio; HS-CRP, high-sensitivity C-reactive protein.
Table 3.
Univariate analysis of PNI and NLR components for GI symptoms
| Variable | OR (95% CI) | P-value |
|---|---|---|
| Serum albumin | 0.266 (0.093–0.763) | 0.014 |
| Absolute lymphocyte count | 0.999 (0.998–1.000) | 0.083 |
| Absolute neutrophil count | 1.000 (1.000–1.000) | 0.970 |
Univariate logistic regression analysis for the individual components of PNI (serum albumin, absolute lymphocyte count) and NLR (absolute neutrophil count, absolute lymphocyte count) to identify the primary driver of the association with GI symptoms.
PNI, prognostic nutritional index; NLR, neutrophil-to-lymphocyte ratio; GI, gastrointestinal; OR, odds ratio; CI, confidence interval.
- 1. Zhang L, Ma W, Qiu Z, Kuang T, Wang K, Hu B, et al. Prognostic nutritional index as a prognostic biomarker for gastrointestinal cancer patients treated with immune checkpoint inhibitors. Front Immunol 2023;14:1219929.ArticlePubMedPMC
- 2. Adachi Y, Akino K, Nojima M, Himori R, Kikuchi T, Mita H, et al. Prognostic nutritional index and early mortality with percutaneous endoscopic gastrostomy. QJM 2018;111:635-41. ArticlePubMed
- 3. Ayman AR, Khoury T, Cohen J, Chen S, Yaari S, Daher S, et al. Peg insertion in patients with dementia does not improve nutritional status and has worse outcomes as compared with peg insertion for other indications. J Clin Gastroenterol 2017;51:417-20. ArticlePubMed
- 4. Han DS. Selection of the enterostomy feeding route in enteral nutrition. Ann Clin Nutr Metab 2022;14:50-4. Article
- 5. Vandenbroucke JP, von Elm E, Altman DG, Gotzsche PC, Mulrow CD, Pocock SJ, et al. Strengthening the Reporting of Observational Studies in Epidemiology (STROBE): explanation and elaboration-a Korean translation. Ewha Med J 2024;47:e31.ArticlePubMedPMCPDF
- 6. Zahorec R. Ratio of neutrophil to lymphocyte counts: rapid and simple parameter of systemic inflammation and stress in critically ill. Bratisl Lek Listy 2001;102:5-14. PubMed
- 7. Guo Y, Cai K, Mao S, Zhang J, Wang L, Zhang Z, et al. Preoperative C-reactive protein/albumin ratio is a significant predictor of survival in bladder cancer patients after radical cystectomy: a retrospective study. Cancer Manag Res 2018;10:4789-804. ArticlePubMedPMCPDF
- 8. Onodera T, Goseki N, Kosaki G. Prognostic nutritional index in gastrointestinal surgery of malnourished cancer patients. Nihon Geka Gakkai Zasshi 1984;85:1001-5. PubMed
- 9. Uri I, Horvath A, Tamas L, Polony G, Danos K. Prognostic nutritional index (PNI) correlates with survival in head and neck cancer patients more precisely than other nutritional markers: real world data. Eur Arch Otorhinolaryngol 2024;281:6599-611. ArticlePubMedPMCPDF
- 10. Li P, Lai Y, Tian L, Zhou Q. The prognostic value of prognostic nutritional index in advanced cancer receiving PD-1/L1 inhibitors: a meta-analysis. Cancer Med 2022;11:3048-56. PubMedPMC
- 11. Cadwell JB, Afonso AM, Shahrokni A. Prognostic nutritional index (PNI), independent of frailty is associated with six-month postoperative mortality. J Geriatr Oncol 2020;11:880-4. ArticlePubMedPMC
- 12. Lu Y, Ren C, Jiang J. The relationship between prognostic nutritional index and all-cause mortality in critically ill patients: a retrospective study. Int J Gen Med 2021;14:3619-26. ArticlePubMedPMCPDF
- 13. Saunders J, Smith T. Malnutrition: causes and consequences. Clin Med (Lond) 2010;10:624-7. ArticlePubMedPMC
- 14. Idasiak-Piechocka I, Lewandowski D, Swigut W, Kalinowski J, Mikosza K, Suchowiejski P, et al. Effect of hypoalbuminemia on drug pharmacokinetics. Front Pharmacol 2025;16:1546465.ArticlePubMedPMC
- 15. Doherty WL, Winter B. Prokinetic agents in critical care. Crit Care 2003;7:206-8. ArticlePubMedPMC
- 16. Lewis K, Alqahtani Z, Mcintyre L, Almenawer S, Alshamsi F, Rhodes A, et al. The efficacy and safety of prokinetic agents in critically ill patients receiving enteral nutrition: a systematic review and meta-analysis of randomized trials. Crit Care 2016;20:259.ArticlePubMedPMC
- 17. Raphaeli O, Statlender L, Hajaj C, Bendavid I, Goldstein A, Robinson E, et al. Using machine-learning to assess the prognostic value of early enteral feeding intolerance in critically ill patients: a retrospective study. Nutrients 2023;15:2705.ArticlePubMedPMC
References
Figure & Data
REFERENCES
Citations
Citations to this article as recorded by 
- Comment on “impact of percutaneous endoscopic gastrostomy (PEG) timing on mortality in intensive care unit patients: The modifying role of the prognostic nutritional index (PNI)”
M. Ganesan, K. Suresh Babu, K. Srinivasa Galu, Ponazhagan
Clinical Nutrition ESPEN.2026; 74: 103361. CrossRef
 Cite
CitePreprocedural prognostic nutritional index predicts early gastrointestinal symptoms after percutaneous endoscopic gastrostomy or percutaneous radiologic gastrostomy in Korea: a retrospective cohort study
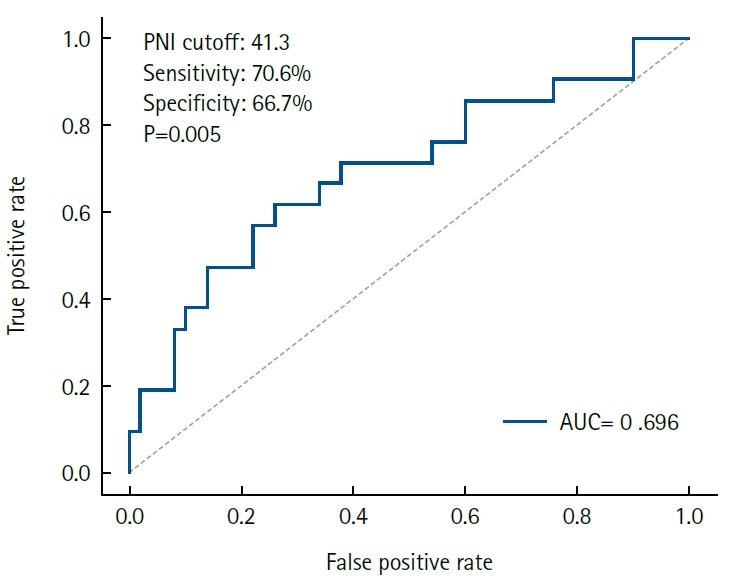
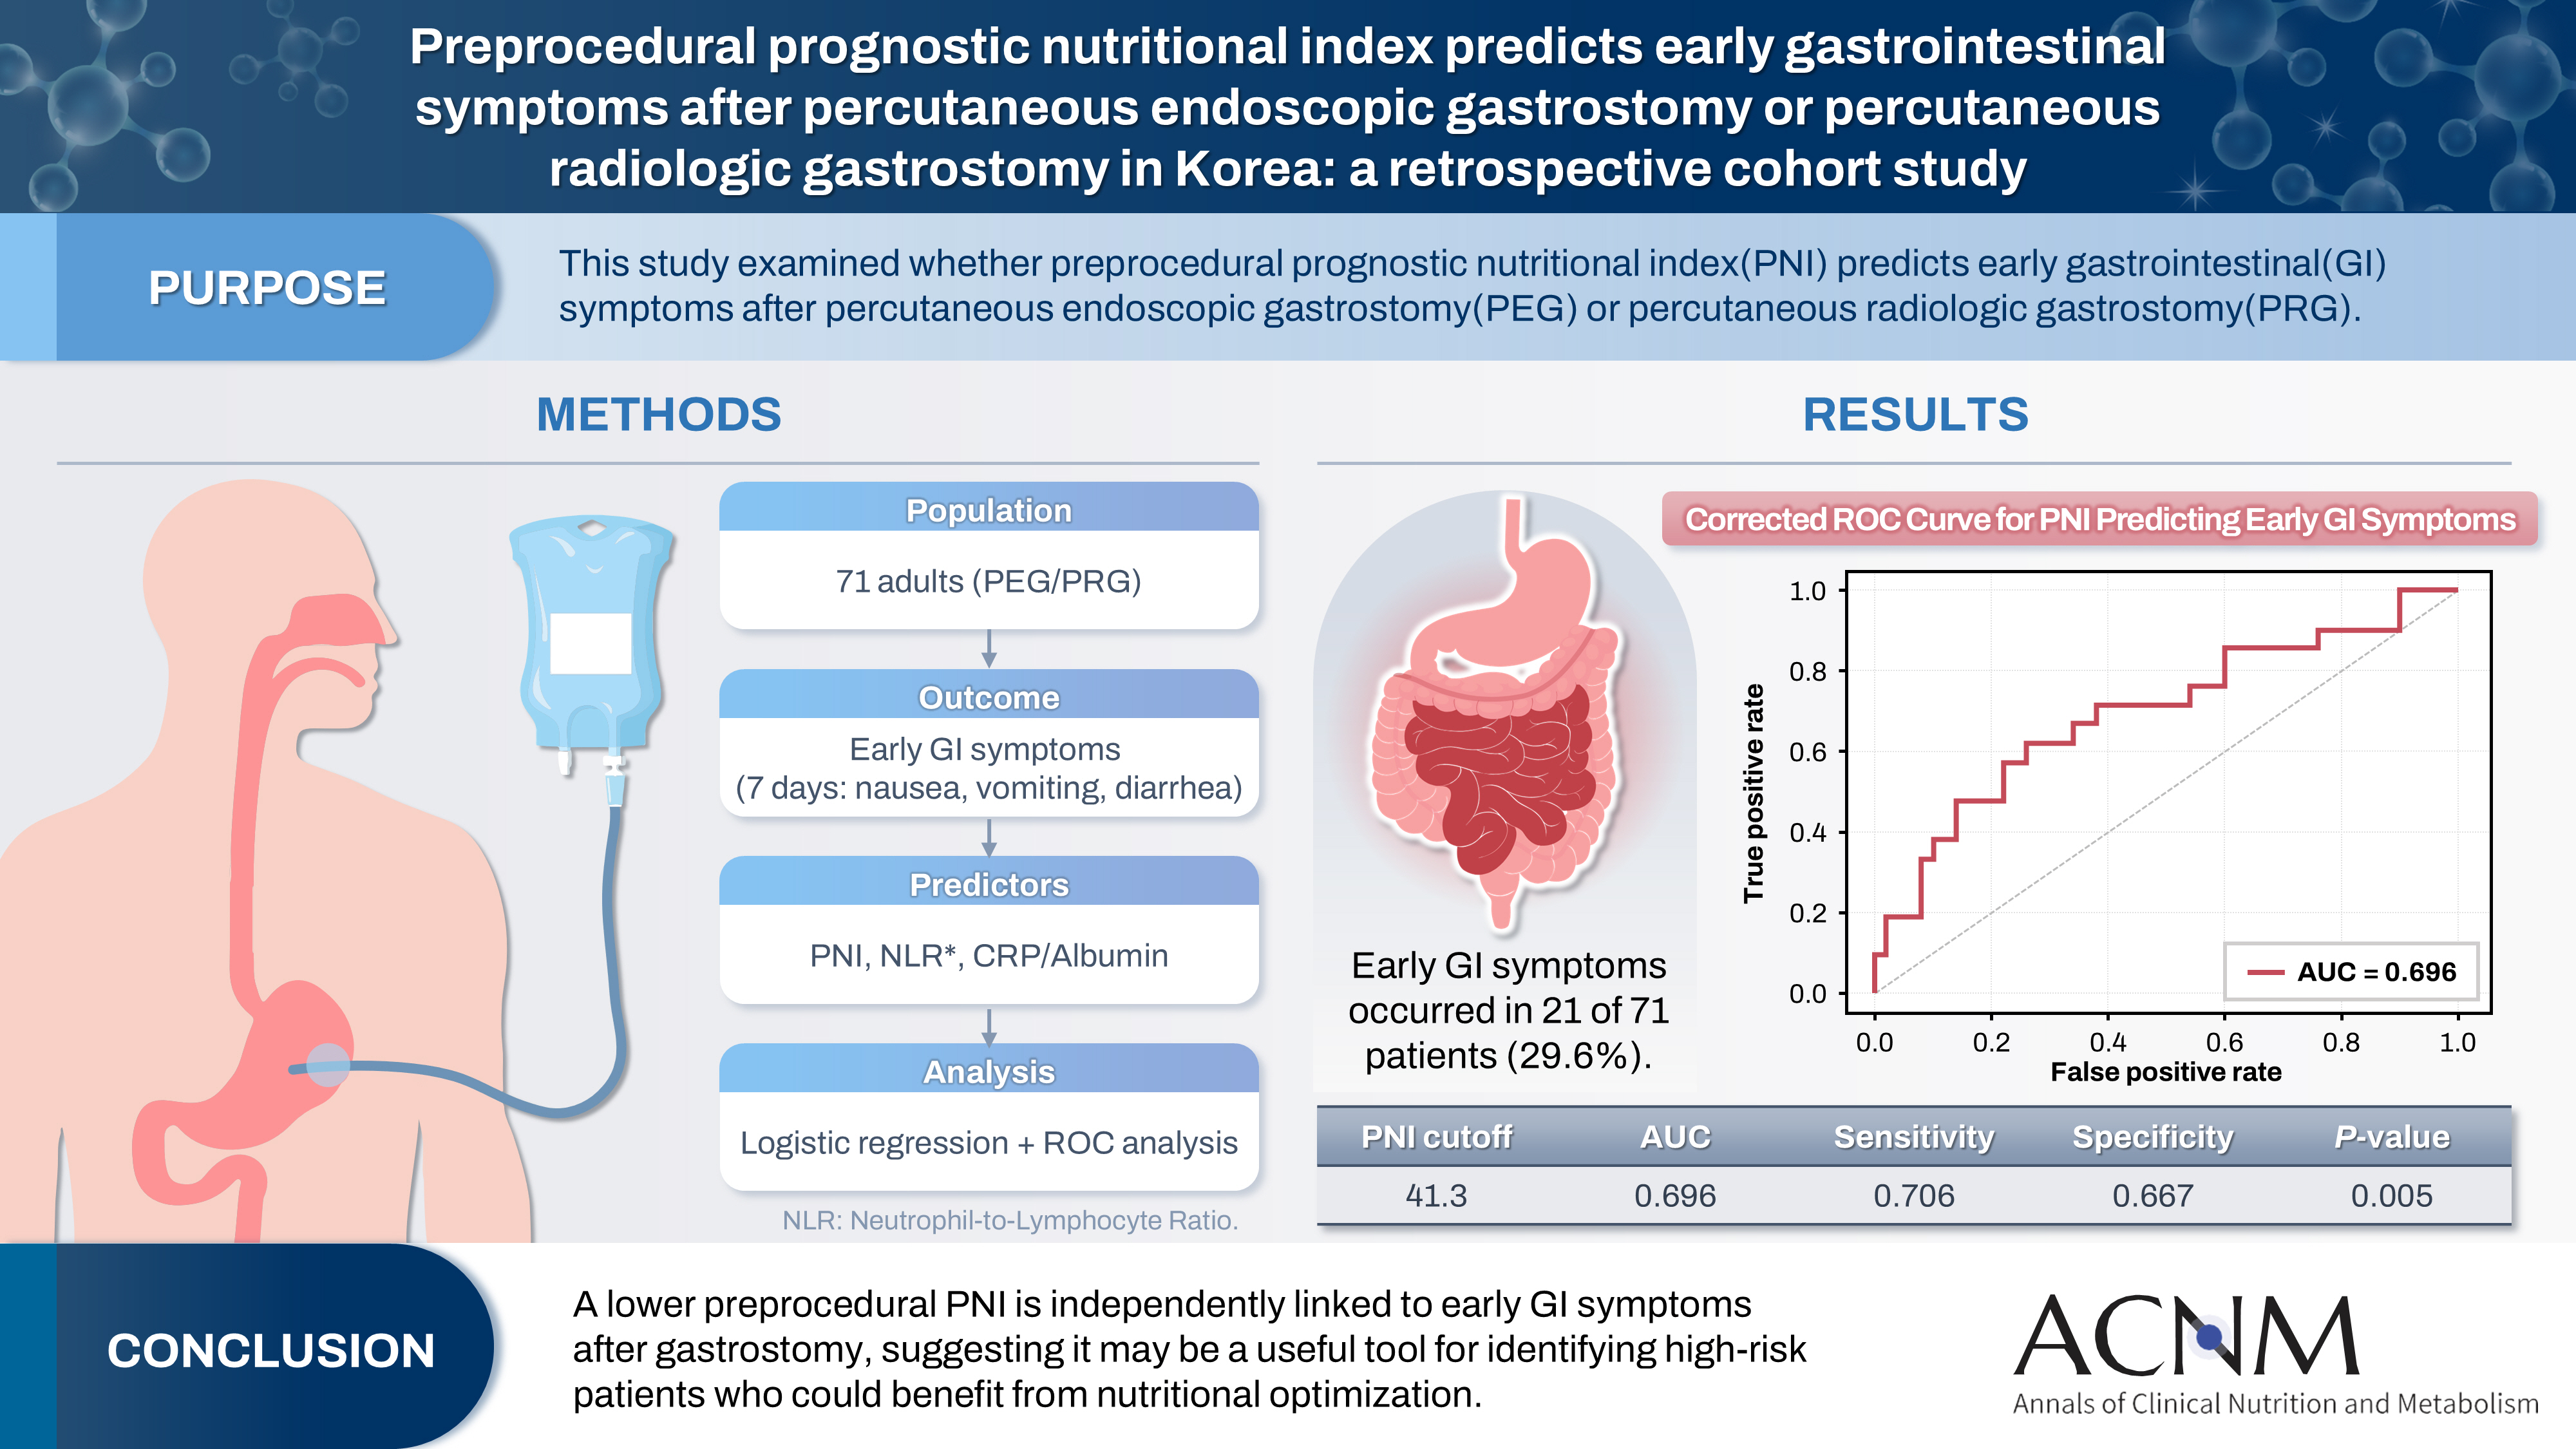
Fig. 1. Results of the receiver operating characteristic curve analysis for prognostic nutritional index. The optimal cutoff value was determined using the Youden index. AUC, area under the curve.
Graphical abstract
Fig. 1.
Graphical abstract
Preprocedural prognostic nutritional index predicts early gastrointestinal symptoms after percutaneous endoscopic gastrostomy or percutaneous radiologic gastrostomy in Korea: a retrospective cohort study
| Variable | No GI symptoms (n=50) | GI symptoms (n=21) | P-value |
|---|---|---|---|
| Age (yr), mean±SD | 65.1±14.6 | 68.0±11.0 | 0.356 |
| BMI (kg/m²), mean±SD | 19.6±2.7 | 19.8±3.4 | 0.814 |
| Male sex, No. (%) | 35 (70.0) | 17 (81.0) | 0.369 |
| Procedure type, No. (%) | 0.944 | ||
| PEG | 36 (72.0) | 16 (76.2) | |
| PRG | 14 (28.0) | 5 (23.8) | |
| LOS (day), mean±SD | 29.0±3.9 | 57.0±11.3 | <0.001 |
| Preprocedural LOS (day), mean±SD | 16.3±2.3 | 21.2±8.2 | 0.820 |
| Postprocedural LOS (day), mean±SD | 12.7±2.3 | 35.8±5.1 | <0.001 |
| PNI, mean±SD | 45.6±6.9 | 40.3±7.9 | 0.011 |
| NLR, mean±SD | 6.5±5.1 | 9.8±10.9 | 0.187 |
| Variable | Univariable analysis | Multivariable analysis | ||
|---|---|---|---|---|
| OR (95% CI) | P-value | Adjusted OR (95% CI) | P-value | |
| Age | 1.02 (0.98–1.06) | 0.404 | 1.00 (0.96–1.05) | 0.963 |
| BMI | 1.02 (0.86–1.22) | 0.791 | 1.06 (0.86–1.30) | 0.593 |
| Sex | 0.80 (0.25–2.61) | 0.716 | 0.60 (0.16–2.23) | 0.445 |
| PNI | 0.90 (0.83–0.97) | 0.009 | 0.90 (0.83–0.98) | 0.021 |
| NLR | 1.06 (0.98–1.15) | 0.125 | 1.03 (0.95–1.12) | 0.491 |
| CRP-to-albumin ratio | 1.40 (1.06–1.85) | 0.018 | - | - |
| Variable | OR (95% CI) | P-value |
|---|---|---|
| Serum albumin | 0.266 (0.093–0.763) | 0.014 |
| Absolute lymphocyte count | 0.999 (0.998–1.000) | 0.083 |
| Absolute neutrophil count | 1.000 (1.000–1.000) | 0.970 |
Table 1. Baseline characteristics according to early GI symptoms
Comparison of demographic and clinical characteristics between patients with and without early GI symptoms following PEG/PRG. GI, gastrointestinal; SD, standard deviation; BMI, body mass index; PEG, percutaneous endoscopic gastrostomy; PRG, percutaneous radiologic gastrostomy; LOS, length of stay; PNI, prognostic nutritional index; NLR, neutrophil-to-lymphocyte ratio. P-values were determined using Student t test or chi-square test, as applicable.
Table 2. Univariable and multivariable logistic regression analyses for predicting early gastrointestinal symptoms
The multivariate logistic regression model included variables considered clinically fundamental or those showing a strong trend in univariate analysis (e.g., age, BMI, PNI). Variables such as serum albumin, HS-CRP, and CRP-to-albumin ratio were excluded from the final multivariate model—despite their univariate significance—to avoid multicollinearity. This is because PNI and the CRP-to-albumin ratio are composite indices calculated from serum albumin and/or CRP, leading to statistical interference when included simultaneously. NLR was also excluded due to its lack of significant association in the univariate analysis. OR, odds ratio; CI, confidence interval; BMI, body mass index; PNI, prognostic nutritional index; NLR, neutrophil-to-lymphocyte ratio; HS-CRP, high-sensitivity C-reactive protein.
Table 3. Univariate analysis of PNI and NLR components for GI symptoms
Univariate logistic regression analysis for the individual components of PNI (serum albumin, absolute lymphocyte count) and NLR (absolute neutrophil count, absolute lymphocyte count) to identify the primary driver of the association with GI symptoms. PNI, prognostic nutritional index; NLR, neutrophil-to-lymphocyte ratio; GI, gastrointestinal; OR, odds ratio; CI, confidence interval.

