 E-submission
Indexed in:
Scopus, KCI, KoreaMed
Scopus, KCI, KoreaMed

Articles
- Page Path
- HOME > Ann Clin Nutr Metab > Volume 18(1); 2026 > Article
- Original Article Association of soy oil-based lipid injectable emulsion with early body weight loss after minimally invasive esophagectomy in Japan: a retrospective cohort study
-
Tomonori Narita1,2
 , Kazuhiko Fukatsu2,3, Kenichi Kono3, Satoshi Murakoshi3,4, Reo Inoue3, Midori Noguchi3, Nana Matsumoto2, Shoh Yajima1, Koichi Yagi1, Yoshifumi Baba1
 -
Annals of Clinical Nutrition and Metabolism 2026;18(1):34-43.
DOI: https://doi.org/10.15747/ACNM.25.0030
Published online: March 30, 2026
1Department of Gastrointestinal Surgery, Graduate School of Medicine, The University of Tokyo, Tokyo, Japan
2Operating Room Management and Surgical Metabolism, Graduate School of Medicine, The University of Tokyo, Tokyo, Japan
3Surgical Center, The University of Tokyo Hospital, Tokyo, Japan
4Faculty of Health and Social Work, School of Nutrition and Dietetics, Kanagawa University of Human Services, Kanagawa, Japan
- Corresponding author: Tomonori Narita, e-mail: tomnrt@outlook.jp
• Received: August 13, 2025 • Revised: December 10, 2025 • Accepted: January 12, 2026
© 2026 The Korean Society of Surgical Metabolism and Nutrition · The Korean Society for Parenteral and Enteral Nutrition · Asian Society of Surgical Metabolism and Nutrition
This is an Open Access article distributed under the terms of the Creative Commons Attribution Non-Commercial License (http://creativecommons.org/licenses/by-nc/4.0), which permits unrestricted non-commercial use, distribution, and reproduction in any medium, provided the original work is properly cited.
- 681 Views
- 13 Download
Abstract
-
Purpose Postoperative body weight loss (PBWL) is associated with poor long-term outcomes following esophagectomy for esophageal cancer, underscoring the critical importance of perioperative nutritional management. Although minimally invasive procedures, such as robot-assisted radical transmediastinal esophagectomy (RA-TME), have become increasingly prevalent, perioperative nutritional strategies have received comparatively limited attention. This study evaluated the impact of soy oil-based injectable lipid emulsion (SO-ILE) on PBWL in patients undergoing RA-TME.
-
Methods We retrospectively analyzed 155 patients who underwent RA-TME for esophageal or esophagogastric junction cancer at our hospital between 2011 and 2022. Patients were divided into two groups: the lipid (+) group (n=33), which received SO-ILE between postoperative days 1 and 6, and the lipid (–) group (n=122), which did not receive SO-ILE. Oral or enteral nutrition was withheld until postoperative day 6. Nutrient intake, postoperative outcomes, and nutritional status were compared between the two groups.
-
Results Patient backgrounds, surgical outcomes, and postoperative complication rates were similar between the two groups. However, patients in the lipid (+) group received significantly greater total energy and nutrient intake. PBWL at 2 weeks after surgery was significantly lower in the lipid (+) group than in the lipid (–) group (5.8% vs. 7.4%; P=0.027). Univariate analysis showed that absence of SO-ILE administration was the only significant risk factor for PBWL greater than 5% at 2 weeks after RA-TME (P=0.038).
-
Conclusion SO-ILE may have the potential to mitigate early PBWL after RA-TME.
Graphical abstract
Introduction
Esophageal cancer is the 10th most common malignancy worldwide and has the sixth poorest prognosis among all cancers [1]. Multidisciplinary treatment approaches, including surgery, radiation therapy, and chemotherapy, play essential roles in its management. Among these modalities, esophagectomy remains the standard treatment for esophageal cancer. However, it is a highly catabolic procedure and is associated with substantial risks of postoperative body weight loss (PBWL), severe complications, and hospital mortality. Moreover, pronounced PBWL has been linked to poor long-term outcomes following esophagectomy [2-4]. Accordingly, various strategies have been implemented to reduce surgical stress, including advances in minimally invasive techniques, maintenance of adequate nutritional status, and enhanced postoperative recovery protocols [5-7].
We developed robot-assisted radical transmediastinal esophagectomy (RA-TME), a nontransthoracic esophagectomy with radical mediastinal lymphadenectomy that combines a robotic transhiatal approach with a video-assisted cervical approach, to reduce surgical invasiveness. This technique has been employed at our institution since 2011. In our previous studies, we demonstrated that RA-TME shortens hospital stay, reduces pulmonary morbidity, and provides superior postoperative quality of life compared with conventional transthoracic esophagectomy [8,9].
Because RA-TME is considerably less invasive than conventional open thoracic surgery, most patients are discharged without major complications at approximately postoperative day (POD) 17. As a result, our current standard clinical pathway does not include the creation of a feeding jejunostomy or placement of a central venous catheter (CVC). Instead, patients are maintained on peripheral parenteral nutrition (PPN) alone until oral intake is initiated. While this approach avoids CVC- and jejunostomy-related complications that were previously encountered, it also restricts total caloric delivery due to insufficient lipid and amino acid provision. Consequently, patients may experience an early postoperative negative energy balance.
In Japan, perioperative parenteral nutrition formulations that contain large amounts of glucose as the primary energy substrate have traditionally been prescribed, whereas lipid calories are often minimized because of safety concerns. Early intensive care unit studies reported associations between high-dose soy oil-based injectable lipid emulsions (SO-ILEs) and exacerbated systemic inflammation, cholestasis, and liver disease [10-13]. Nevertheless, SO-ILEs provide essential fatty acids and energy-dense calories. Because fish oil-based lipid emulsion products have not yet been introduced into routine clinical practice in Japan, SO-ILEs remain the only intravenously administered lipid products commercially available.
Several previous studies have evaluated the role of SO-ILEs in postoperative nutritional management. Some reports have suggested that SO-ILEs contribute to maintaining energy balance and preventing excessive catabolism after major surgery, whereas others have raised concerns regarding inflammatory or hepatic adverse effects, particularly with high-dose administration [14,15]. However, the clinical impact of low-dose SO-ILE administration after minimally invasive esophagectomy has not been clearly established.
The aim of this study was to determine whether the addition of SO-ILE to parenteral nutrition influences short- or long-term clinical outcomes in patients undergoing a minimally invasive esophagectomy procedure, specifically RA-TME.
Methods
This study was approved by the Ethics Committee of the University of Tokyo Hospital (approval No. 3962). Written informed consent was waived by the institutional review board because of the retrospective nature of the study.
This was a retrospective cohort study with a single-center, nonrandomized, exposure-based comparative design.
Electronic medical records were reviewed for patients who underwent RA-TME with gastric conduit reconstruction for esophageal or esophagogastric junction cancer at the University of Tokyo Hospital between January 2011 and December 2022. All included patients received neither oral nutrition nor enteral nutrition prior to POD 6.
Surgical methods
RA-TME with two- or three-field lymphadenectomy was performed in three stages, with all procedures conducted while the patient was in the supine position [16]. In the first stage, lymph node dissections in the cervical and abdominal fields were performed simultaneously by two surgical teams. The cervical procedure was carried out via a collar incision under mediastinoscopic guidance, whereas the abdominal procedure was performed laparoscopically. In the second stage, a robotic surgical system, either the da Vinci S or Xi (Intuitive Surgical), was used to perform the transhiatal robotic procedure through the abdominal ports. During the combined cervical collar incision and transhiatal da Vinci procedures, the entire esophagus and the dissected mediastinal lymph nodes were mobilized and freed from surrounding adhesions and attachments. After completion of mediastinal dissection, the da Vinci S or Xi robotic system was withdrawn from the operative field. The final stage included retrieval of the surgical specimens, reconstruction using a gastric tube conduit, and creation of a cervical anastomosis.
Postoperative nutrition protocol
Postoperative nutritional management followed a standardized prescription. All patients began taking ice on POD 3, and drinking water was initiated on POD 7. On POD 7, patients started a clear liquid diet and gradually advanced to pureed food and subsequently to regular meals. Patients consumed only hospital-provided food during the postoperative period. The timing of initiation and advancement of oral intake could be adjusted according to the patient’s clinical condition and the attending physician’s judgment. Until oral intake was initiated, patients received intravenous infusions only. The composition of these infusions, including the inclusion of lipid injectable emulsions or amino acids, was determined by the attending physicians.
Among the target population, patients with residual tumors after surgery were excluded from the present study. Eligible patients were classified into two groups: the lipid (+) group (n=33), who received SO-ILE between POD 1 and POD 6, and the lipid (–) group (n=122), who did not receive SO-ILE.
The exposure variable was administration of SO-ILE at least once during POD 1 through POD 6. The primary outcome was PBWL at 2 weeks, calculated as the percentage change from baseline body weight. Secondary outcomes included serial measurements of body weight, body composition, and hematological parameters at the preoperative baseline and at POD 6–8, 12–16, and 25–35; postoperative complications graded according to the Clavien-Dindo classification by POD 14; and overall survival (OS) and relapse-free survival (RFS) at 2 years. Covariates included age, sex, body mass index, skeletal muscle index, Short Physical Performance Battery (SPPB) score, American Society of Anesthesiologists Physical Status class, and the presence of sarcopenia.
Data were extracted from the institutional database and electronic medical records. Hematological parameters and body weight were assessed at four time points: preoperatively, and at 1 week (POD 6–8), 2 weeks (POD 12–16), and 4 weeks (POD 25–35) postoperatively. Physical performance was assessed using the SPPB, and perioperative risk was evaluated using the American Society of Anesthesiologists Physical Status classification. Sarcopenia was defined by the presence of both low physical performance (SPPB ≤9) and low skeletal muscle mass, with skeletal muscle index thresholds of <7.0 kg/m² for men and <5.0 kg/m² for women, as measured by bioelectrical impedance analysis. Postoperative changes in body weight, hematological parameters, muscle strength, and body composition were recorded. Pathological findings were classified according to the 8th edition of the TNM classification published by the Union for International Cancer Control [17]. Postoperative complications were recorded on POD 14, and their severity during hospitalization was graded using the Clavien-Dindo classification [18]. Long-term outcomes included OS and RFS at 2 years. Details of postoperative nutritional intake were calculated based on prescribed intravenous infusions and the types and quantities of hospital-provided food from POD 1 through POD 14. Nutritional intake was additionally normalized by body weight to allow comparisons among individuals with differing body sizes.
This retrospective, single-center study is subject to potential selection bias and confounding by indication, as the decision to administer SO-ILE was made by attending physicians without a standardized nutritional protocol. In addition, baseline group imbalances and temporal changes in clinical practice over the study period may have influenced the results. To minimize information bias, predefined variables were extracted from electronic medical records using standardized definitions, including the Clavien-Dindo classification.
No a priori sample size calculation was performed. The study population consisted of all eligible RA-TME patients treated between 2011 and 2022 who received no oral or enteral nutrition by POD 6 (n=155), including 33 patients in the lipid (+) group and 122 in the lipid (–) group.
Categorical variables are presented as numbers (percentages). Normally distributed continuous variables are expressed as mean±standard deviation, whereas non-normally distributed variables are reported as median (interquartile range). The Student t test was used to compare normally distributed continuous variables, and the Mann-Whitney U test was applied to non-normally distributed continuous variables. Categorical variables were compared using the chi-square test, with the Fisher exact test applied when any expected cell count was less than 10. Longitudinal changes in body weight, body composition, and hematological parameters were analyzed using linear mixed-effects models. Results of logistic regression analyses are presented as odds ratios with 95% confidence intervals. OS and RFS were compared between groups using the log-rank test. A P-value <0.05 was considered statistically significant. All statistical analyses were performed using JMP Pro version 17 (SAS Institute) for Windows.
Results
Fig. 1 presents the flowchart of patient enrollment. Overall, 262 patients underwent RA-TME for esophageal or esophagogastric junction cancer at our hospital between 2011 and 2022. Among these patients, 155 who received only intravenous infusions prior to POD 6, without oral or enteral nutrition, were included in the analysis. Patients were divided into two groups: a lipid (+) group (n=33), who received intravenous infusions containing SO-ILE at least once between surgery and POD 6, and a lipid (–) group (n=122), who were not prescribed SO-ILE during this period. Table 1 summarizes preoperative patient characteristics. Significant differences were observed in aspartate aminotransferase (AST) levels, which were higher in the lipid (+) group than in the lipid (–) group. However, values in both groups remained within the normal reference range.
There were no significant differences between the two groups in intraoperative parameters, including operative time, intraoperative blood loss, or reconstruction route (Table 2). Postoperative outcomes are shown in Table 3. No significant differences were observed between the two groups in postoperative complications, length of hospital stay, or pathological outcomes. Linear mixed-effects model analyses demonstrated that the lipid (+) group had significantly higher overall postoperative levels of white blood cell count (WBC; P=0.033), neutrophils (P=0.007), C-reactive protein (CRP; P=0.002), and neutrophil-to-lymphocyte ratio (NLR; P=0.003) compared with the lipid (–) group (Table 4). These results indicate that patients who received SO-ILE exhibited higher systemic inflammatory markers across the postoperative course. Although contrast analyses showed no statistically significant differences at any specific postoperative time point, the overall longitudinal trends differed between groups. Hepatic markers, including AST, alanine aminotransferase (ALT), γ-glutamyl transpeptidase (γ-GTP), and total bilirubin, did not differ significantly between the two groups, suggesting that SO-ILE administration was not associated with clinically relevant hepatic injury.
Fig. 2 illustrates postoperative nutritional intake. In the lipid (+) group, not only fat intake but also total energy and amino acid administration during the observation periods were significantly higher than in the lipid (–) group. No significant differences were observed in intravenous fluid volume at any observational time point between the two groups.
PBWL at 2 weeks after surgery was significantly lower in the lipid (+) group than in the lipid (–) group (Fig. 3). In addition, absence of SO-ILE administration was identified as the only risk factor for PBWL greater than 5% at 2 weeks after RA-TME in univariate analysis (Table 5). However, no significant risk factors were identified in multivariate analyses (Table 6). Body composition parameters, including muscle mass and body fat percentage, assessed at 4 weeks after surgery did not differ significantly between the two groups (Supplement 1).
Among patients with pathological Stage II disease (n=29), the 2-year RFS rate was 100% (5/5) in the lipid (+) group and 60.9% (14/23) in the lipid (–) group. However, this difference did not reach statistical significance (Fisher exact test, P=0.090; log-rank test, P=0.119). In the overall cohort, as well as among patients with pathological Stage I, III, or IV disease, no significant differences in OS or RFS were observed between the lipid (+) and lipid (–) groups.
Discussion
The most important finding of this study was that SO-ILE administration was associated with less PBWL at 2 weeks after RA-TME, without an increased risk of postoperative complications. However, this association does not necessarily indicate a direct causal effect of SO-ILE administration itself. In this study, addition of SO-ILE to PPN during the first postoperative week after RA-TME was associated with reduced early PBWL. Specifically, PBWL at 2 weeks was significantly lower in the lipid (+) group than in the lipid (–) group, and the proportion of patients with PBWL ≥5% at 2 weeks was also significantly lower in the lipid (+) group. To our knowledge, this study uniquely reports a short-term benefit of SO-ILE–supplemented PPN in esophageal cancer patients undergoing minimally invasive esophagectomy, with respect to maintenance of body weight.
The precise mechanism underlying prevention of PBWL in the lipid (+) group cannot be determined from the present study. Nevertheless, fat is essential for the synthesis of various structural components and mediators that regulate responses to surgical stress. In addition to glucose and amino acids, wound healing requires an adequate lipid supply. Accordingly, it is plausible that SO-ILE administration contributed, at least in part, to attenuation of early PBWL.
In Japan, intravenous lipid administration has traditionally been minimized because high-dose SO-ILE provision has been shown to cause severe inflammation, cholestasis, and liver disease [19]. Consistent with these historical concerns, our linear mixed-effects analyses demonstrated that inflammatory markers were generally higher in the lipid (+) group than in the lipid (–) group, as reflected by significantly elevated WBC counts, CRP levels, neutrophil counts, and NLR values across the postoperative course. However, no significant differences were observed at any individual postoperative time point, and liver-related parameters, including AST, ALT, γ-GTP, and total bilirubin, did not differ significantly between groups. These findings suggest that although SO-ILE administration may modestly elevate systemic inflammatory markers at the group level, the relatively low dose used in this study did not induce clinically meaningful hepatic injury or overt inflammatory complications. Furthermore, SO-ILE administration was not associated with an increased incidence of postoperative complications in the lipid (+) group, possibly because the administered dose was relatively small, approximately 0.35 g of lipid per kilogram of body weight per day during PPN. This dosage falls within the generally accepted safe range for SO-ILE administration and is sufficient to supply essential fatty acids [20]. Previous studies have reported detrimental effects of higher SO-ILE doses, approximately 1 g/kg/day, including prolonged intensive care unit stays and excessive inflammation in critically ill patients [21,22]. In contrast, the lower SO-ILE dose used in the present study appears to be both safe and tolerable in patients exposed to surgical stress.
In addition, the contribution of increased total energy and amino acid provision to postoperative body weight maintenance in the lipid (+) group cannot be excluded. It remains unclear whether reduced PBWL was attributable to SO-ILE administration itself or to differences in overall energy or amino acid delivery. Although univariate analysis identified SO-ILE administration as a significant factor associated with reduced PBWL, this association was no longer significant in multivariate analysis. Accordingly, we cannot emphasize an independent effect of SO-ILE on postoperative body weight change. Conversely, because cumulative differences in total energy, fat, and amino acid intake increased progressively over time, these nutritional differences themselves may have contributed to the observed reduction in PBWL. Owing to the limited sample size, we were unable to perform analyses matched for total energy and amino acid provision between groups. Future studies with controlled and equivalent energy and amino acid delivery will be necessary to clarify the independent effect of SO-ILE administration.
Reduced PBWL was not associated with lower rates of postoperative complications or shorter hospital stays in the present study. Beyond its caloric contribution, lipid emulsion may exert biological effects. Polyunsaturated fatty acids have been shown to modulate inflammatory pathways and may attenuate postoperative catabolism [14]. Although the present study was not designed to investigate mechanistic pathways, these potential effects warrant further investigation. Because PBWL has been reported to adversely affect long-term survival after esophagectomy in cancer patients, PPN supplemented with SO-ILE may contribute to improved long-term outcomes [23]. Indeed, among patients with pathological Stage II disease, RFS at 2 years tended to be better in the lipid (+) group than in the lipid (–) group, although this difference did not reach statistical significance. Given the small sample size, further accumulation of cases will be required to evaluate this potential association.
First, this study had a retrospective, single-center design with a relatively small sample size, which limits generalizability. The imbalance in group size (lipid [+] group, n=33; lipid [–] group, n=122) reduces statistical power and may have introduced bias. In particular, the number of patients with body composition measurements at 4 weeks was limited, as the first postoperative outpatient visit was not routinely scheduled at this time point. Second, the decision to administer SO-ILE was made by attending physicians in the absence of a standardized nutritional protocol. Some physicians may have paid closer attention to intravenous nutritional composition and prescribed SO-ILE, whereas others may not have prioritized nutritional management. Third, long-term outcomes were evaluated only up to 2 years after surgery. Fourth, because total energy and amino acid provision differed between groups, we cannot exclude the possibility that PBWL was influenced primarily by overall nutrient supply rather than by lipid administration per se. Finally, the present data suggest only a potential benefit of SO-ILE–supplemented PPN compared with SO-ILE–free PPN, and the optimal postoperative nutritional strategy following this newer esophagectomy procedure remains uncertain.
Although SO-ILE administration did not affect postoperative morbidity, it was associated with reduced body weight loss after RA-TME. While these findings should be interpreted cautiously in light of the study’s limitations, SO-ILE may have the potential to mitigate early PBWL after less invasive RA-TME. Future prospective randomized controlled trials are warranted to confirm these findings and to define optimal perioperative nutritional strategies.
Authors’ contribution
Conceptualization: TN, KF, SM, RI, KK, MN, NM. Data curation: TN. Formal analysis: TN. Investigation: TN. Methodology: TN. Project administration: TN. Resources: TN. Software: TN. Supervision: KF. Validation: TN, KF, IR, KK. Visualization: TN. Writing–original draft: TN. Writing–review & editing: TN, KF, SM, RI, KK, MN, NM, SY, KY, YB. All authors read and approved the final manuscript.
Conflict of interest
The authors have no conflicts of interest regarding the publication of this article.
Funding
None.
Data availability
The raw data supporting the conclusions presented in this article will be made available by the authors upon request.
Acknowledgments
None.
Supplementary materials
Supplementary materials can be found via https://doi.org/10.15747/ACNM.25.0030
Supplement 1.
Body composition and muscle strength in 1 month after surgery.
Fig. 1.

Flow diagram of patient enrollment. Among 262 patients who underwent robot-assisted radical transmediastinal esophagectomy (RA-TME), 155 who received neither oral nor enteral nutrition by postoperative day (POD) 6 were included and classified according to whether they received peripheral parenteral nutrition with soy oil-based lipid injectable emulsion during this period.
Fig. 2.
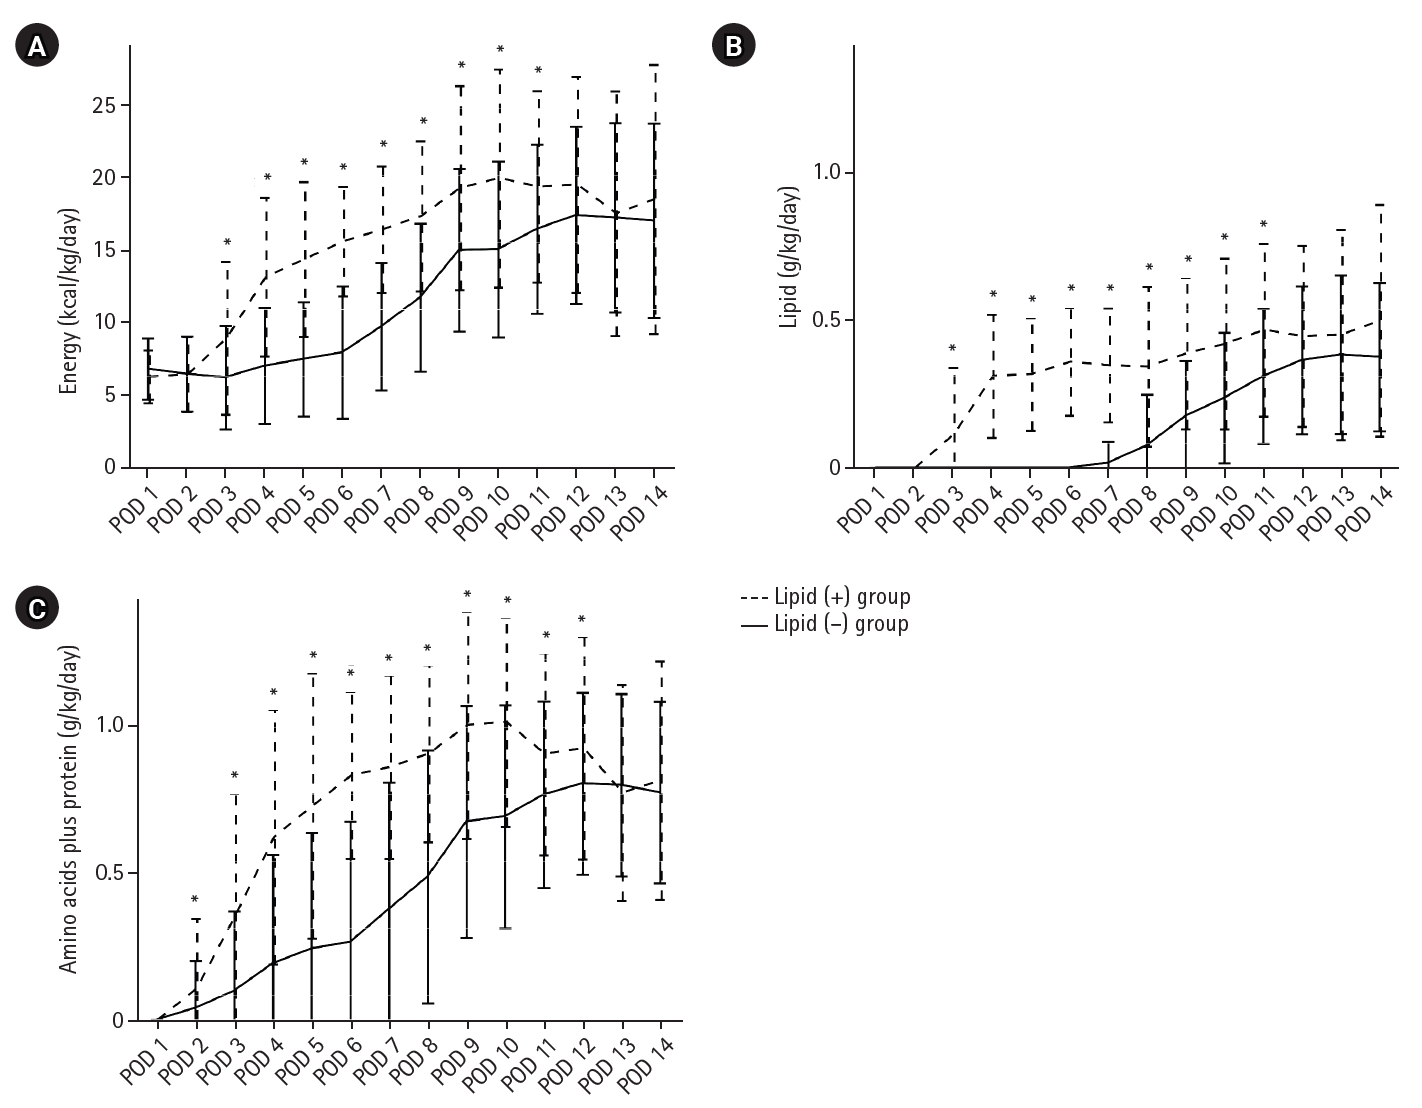
Postoperative nutritional components. Total administered amounts of energy (A), lipid (B), and amino acids plus protein (C) were compared between the two groups from postoperative day (POD) 1 to POD 14. Data are presented as mean±standard deviation. *P-values <0.05 compared with the lipid (–) group at each time point (linear mixed-effects models).
Fig. 3.

Postoperative body weight change. Mean percentage change in body weight from baseline over time in the lipid (+) and lipid (–) groups, presented as mean±confidence interval. *P-values <0.05 compared with the lipid (–) group at each time point (linear mixed-effects models).
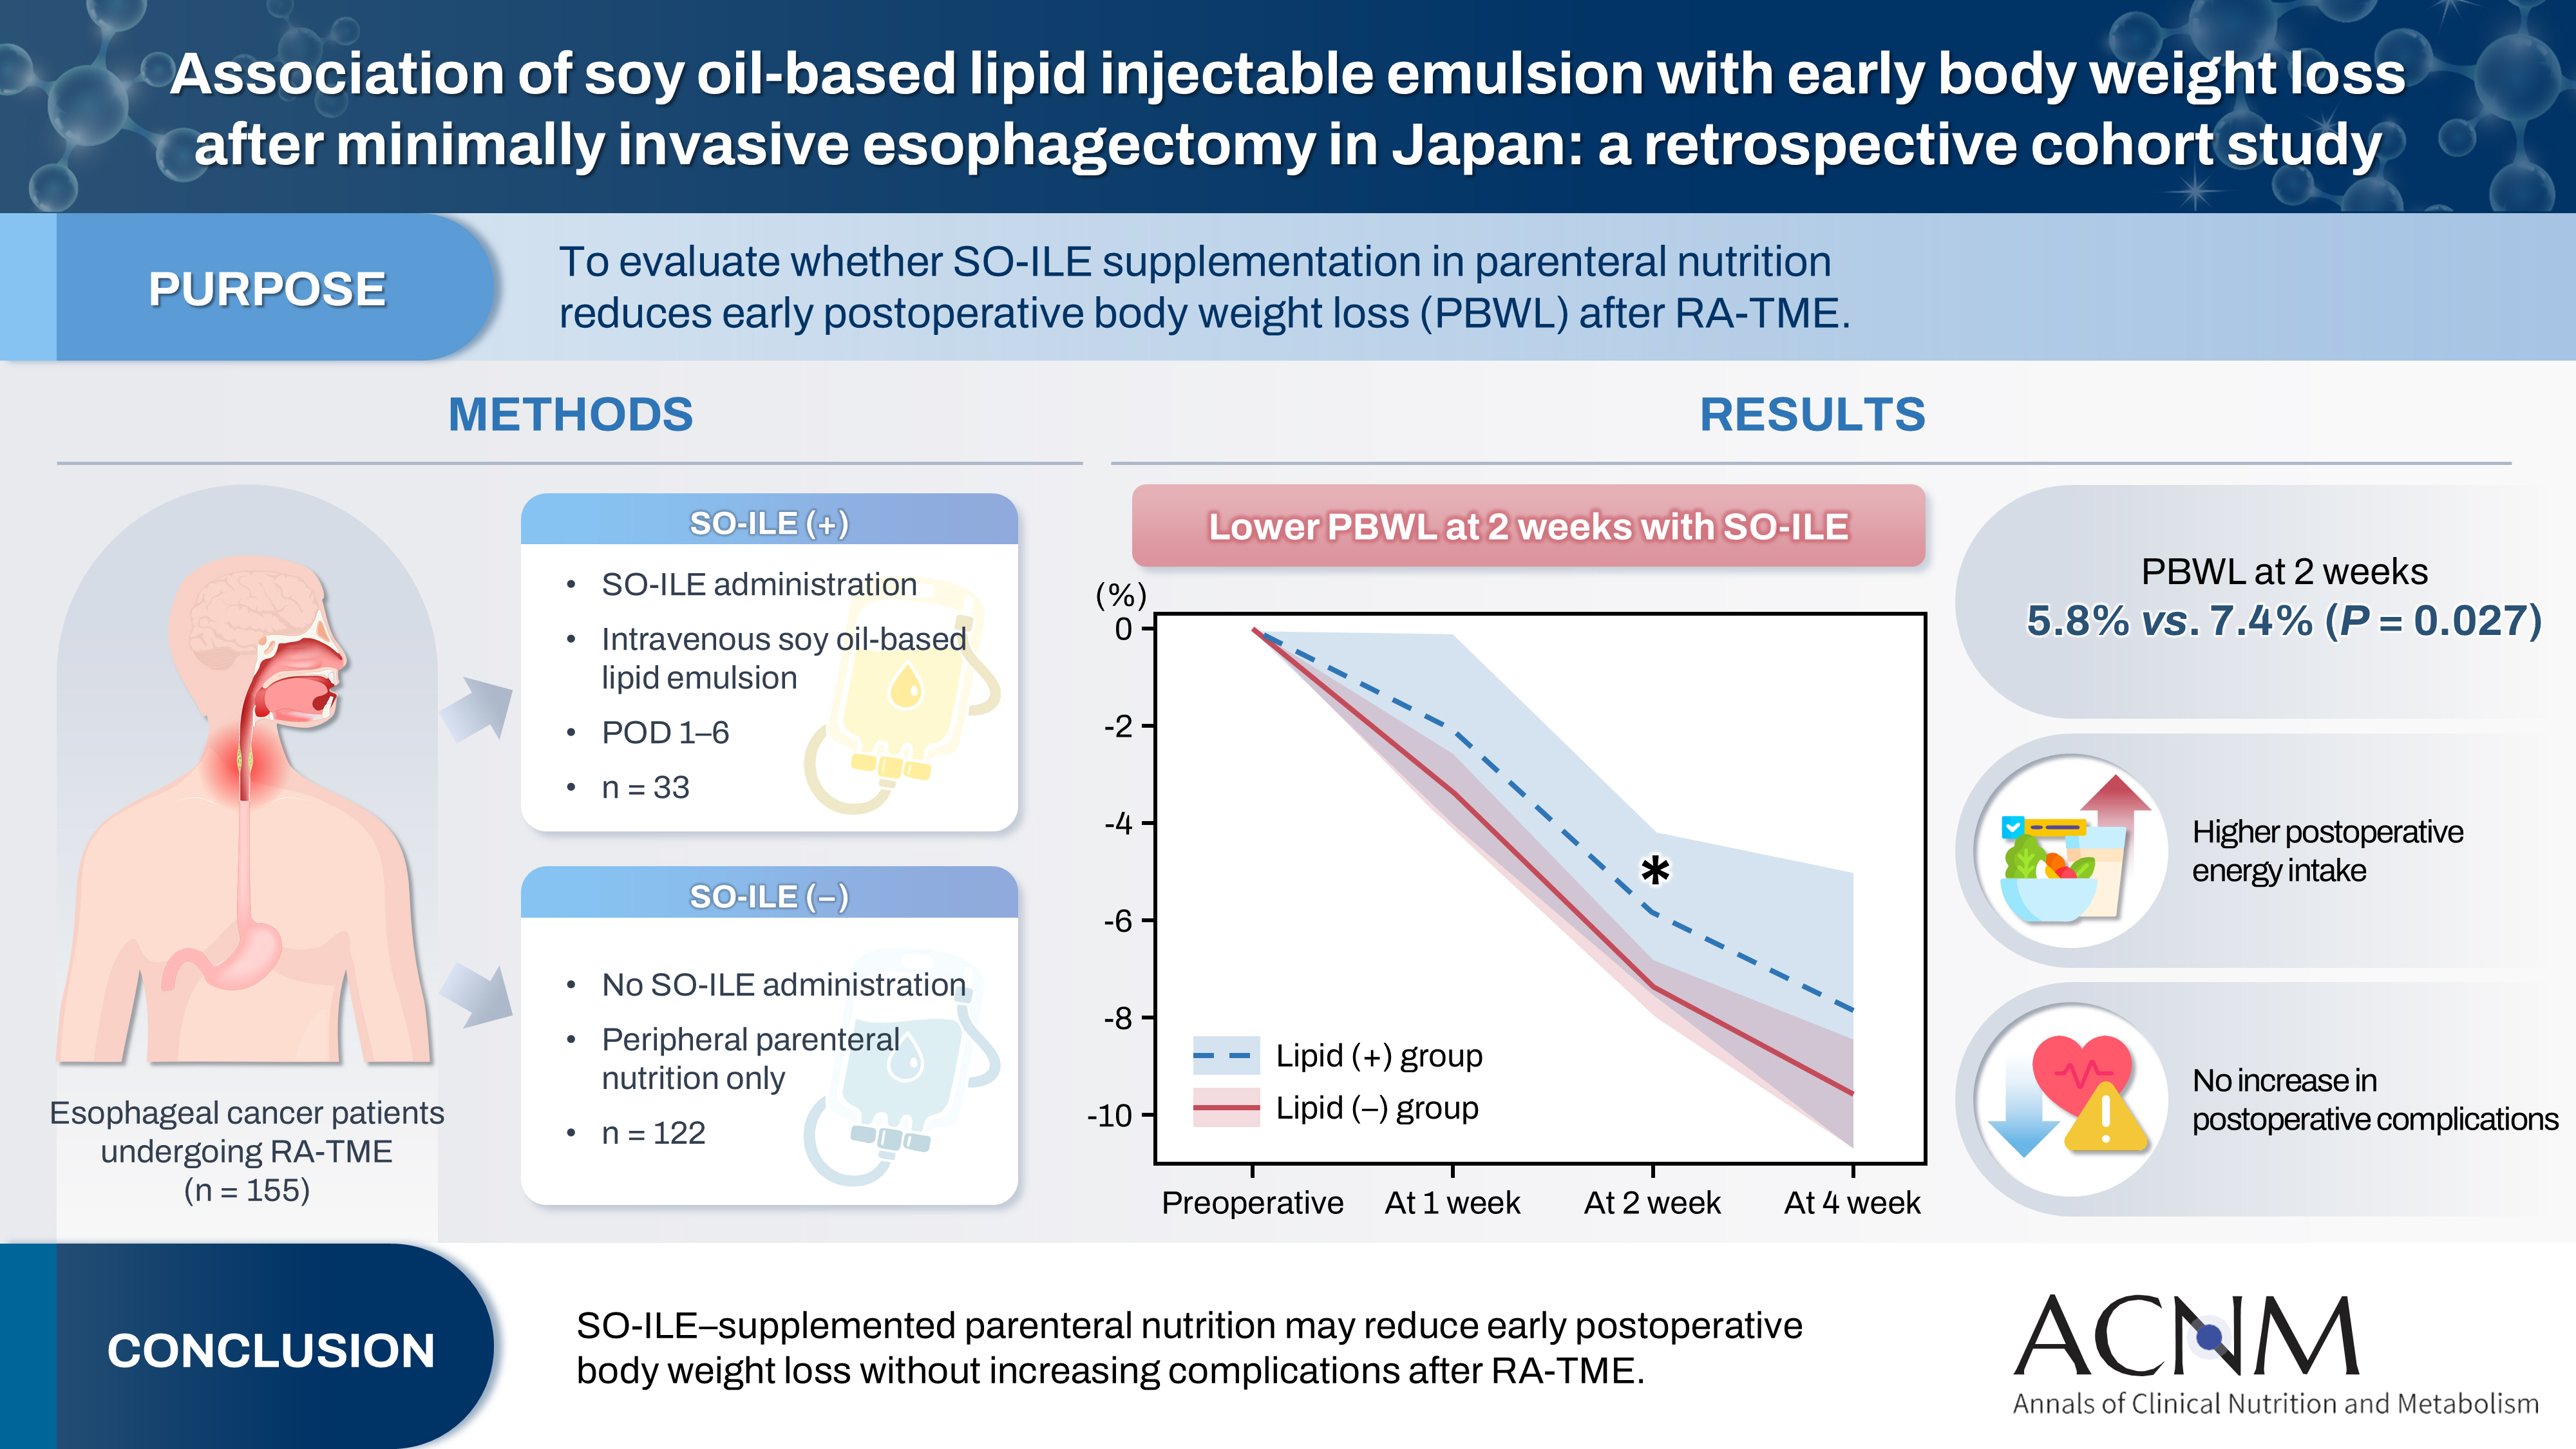
Table 1.
Patients’ characteristics
Values are presented as number (%) or median (interquartile range). SPPB scores and number of sarcopenia include missing values.
BMI, body mass index; SPPB, Short Physical Performance Battery; SMI, skeletal muscle index; ASA-PS, American Society of Anesthesiologists Physical Status classification; AST, aspartate aminotransferase; ALT, alanine aminotransferase; γ-GTP, γ-glutamyl transpeptidase; CRP, C-reactive protein; NLR, neutrophil-to-lymphocyte ratio; PNI, prognostic nutritional index.
Table 2.
Surgical outcomes
Table 3.
Postoperative short-term and pathological outcomes
| Variable | Lipid (+) group (n=33) | Lipid (–) group (n=122) | P-value |
|---|---|---|---|
| Postoperative complicationsa | |||
| CD grade ≥II | 19 (57.6) | 69 (56.6) | 0.917 |
| CD grade ≥III | 10 (30.3) | 31 (25.4) | 0.572 |
| Pneumonia | 7 (21.2) | 18 (14.8) | 0.371 |
| Anastomotic leakage | 8 (24.2) | 19 (15.6) | 0.244 |
| Superficial surgical site infection | 3 (9.1) | 6 (4.9) | 0.363 |
| Postoperative hospital stay (day) | 22 (16–33) | 18 (17–26) | 0.774 |
| Pathological T factor | 0.672 | ||
| pT1 or 2 | 22 (66.7) | 86 (70.5) | |
| pT3 or 4 | 11 (33.3) | 36 (29.5) | |
| Lymph node metastasis | 20 (60.6) | 56 (45.9) | 0.134 |
| Presence | 13 (39.4) | 66 (54.1) | |
| Absence | |||
| Pathological stage | 0.453 | ||
| pStage I | 9 (27.3) | 47 (38.5) | |
| pStage II | 5 (15.2) | 24 (19.7) | |
| pStage III | 15 (45.5) | 40 (32.8) | |
| pStage IV | 4 (12.1) | 11 (9.0) |
Table 4.
Linear mixed-effects models of postoperative hematological findings (lipid (–) group vs. lipid (+) group)
Table 5.
PBWL in the first 2 weeks after RA-TME
| Variable | PBWL in 2 wk RA-TME, No. (%) | P-value | |
|---|---|---|---|
| ≥5% (n=106) | <5% (n=31) | ||
| Sex | 0.093 | ||
| Male | 92 (86.8) | 23 (74.2) | |
| Female | 14 (13.2) | 8 (25.8) | |
| Age ≥75 yr | 20 (18.9) | 9 (29.0) | 0.223 |
| BMI (kg/m2) | |||
| Obesity (≥25) | 17 (16.0) | 5 (16.1) | 0.990 |
| Underweight (≤18.5) | 12 (11.3) | 6 (19.4) | 0.244 |
| Preoperative chemotherapy | 52 (49.1) | 12 (38.7) | 0.310 |
| ASA-PS | 0.059 | ||
| I or II | 100 (94.3) | 26 (83.9) | |
| III | 6 (5.7) | 5 (16.1) | |
| Lymphadenectomy | 0.327 | ||
| Three fields | 22 (20.8) | 4 (12.9) | |
| Two fields | 84 (79.2) | 27 (87.1) | |
| Reconstruction route | 0.218 | ||
| Posterior mediastinal route | 101 (95.3) | 31 (100.0) | |
| Non-posterior mediastinal route | 5 (4.7) | 0 | |
| Pneumonia | 16 (15.1) | 6 (19.4) | 0.570 |
| Anastomotic leakage | 21 (19.8) | 5 (16.1) | 0.646 |
| Superficial surgical site infection | 7 (6.6) | 2 (6.5) | 0.976 |
| Pathological T factor | 0.785 | ||
| pT1 or 2 | 30 (28.3) | 8 (25.8) | |
| pT3 or 4 | 76 (71.7) | 23 (74.2) | |
| Lymph node metastasis | 0.349 | ||
| Presence | 48 (45.3) | 17 (54.84) | |
| Absence | 58 (54.7) | 14 (45.16) | |
| Postoperative complicationsa | |||
| CD grade ≥II | 62 (58.5) | 20 (64.5) | 0.547 |
| CD grade ≥III | 29 (27.4) | 10 (32.3) | 0.595 |
| Lipid use | 19 (17.9) | 11 (35.5) | 0.038 |
| Amino acid use | 45 (42.5) | 18 (58.1) | 0.125 |
| Total energy until POD 6 ≥3,000 kcal | 34 (32.1) | 14 (45.2) | 0.179 |
PBWL, postoperative body weight loss; RA-TME, robot-assisted radical transmediastinal esophagectomy; BMI, body mass index; ASA-PS, the American Society of Anesthesiologists Physical Status classification; CD, Clavien-Dindo classification; POD, postoperative day.
aCD reflects the highest-grade complication per patient.
Table 6.
Logistic regression analysis of risk factors for the rate of PBWL in 2 weeks after RA-TME ≥5%
| Multivariate analysis | ||
|---|---|---|
| OR (95% CI) | P-value | |
| Lipid-free PN | 2.22 (0.89–5.57) | 0.088 |
| Male sex | 2.12 (0.76–5.88) | 0.150 |
| ASA ≤2 | 2.93 (0.78–10.97) | 0.110 |
- 1. Sung H, Ferlay J, Siegel RL, Laversanne M, Soerjomataram I, Jemal A, et al. Global cancer statistics 2020: GLOBOCAN estimates of incidence and mortality worldwide for 36 cancers in 185 countries. CA Cancer J Clin 2021;71:209-49. ArticlePubMedPDF
- 2. Koterazawa Y, Oshikiri T, Takiguchi G, Urakawa N, Hasegawa H, Yamamoto M, et al. Severe weight loss after minimally invasive oesophagectomy is associated with poor survival in patients with oesophageal cancer at 5 years. BMC Gastroenterol 2020;20:407.ArticlePubMedPMCPDF
- 3. Kubo Y, Miyata H, Sugimura K, Shinno N, Asukai K, Hasegawa S, et al. Prognostic implication of postoperative weight loss after esophagectomy for esophageal squamous cell cancer. Ann Surg Oncol 2021;28:184-93. ArticlePubMedPDF
- 4. Yamamoto K, Tanaka K, Yamasaki M, Yamashita K, Makino T, Saito T, et al. Early postoperative weight loss is associated with poor prognosis in patients with esophageal cancer. Esophagus 2022;19:596-603. ArticlePubMedPDF
- 5. Biere SS, van Berge Henegouwen MI, Maas KW, Bonavina L, Rosman C, Garcia JR, et al. Minimally invasive versus open oesophagectomy for patients with oesophageal cancer: a multicentre, open-label, randomised controlled trial. Lancet 2012;379:1887-92. ArticlePubMed
- 6. Cao Y, Han D, Zhou X, Han Y, Zhang Y, Li H, et al. Effects of preoperative nutrition on postoperative outcomes in esophageal cancer: a systematic review and meta-analysis. Dis Esophagus 2022;35:doab028.ArticlePubMedPDF
- 7. Low DE, Allum W, De Manzoni G, Ferri L, Immanuel A, Kuppusamy M, et al. Guidelines for perioperative care in esophagectomy: enhanced recovery after surgery (ERAS®) society recommendations. World J Surg 2019;43:299-330. ArticlePubMedPDF
- 8. Mori K, Yamagata Y, Aikou S, Nishida M, Kiyokawa T, Yagi K, et al. Short-term outcomes of robotic radical esophagectomy for esophageal cancer by a nontransthoracic approach compared with conventional transthoracic surgery. Dis Esophagus 2016;29:429-34. ArticlePubMedPDF
- 9. Yoshimura S, Mori K, Yamagata Y, Aikou S, Yagi K, Nishida M, et al. Quality of life after robot-assisted transmediastinal radical surgery for esophageal cancer. Surg Endosc 2018;32:2249-54. ArticlePubMedPMCPDF
- 10. Tashiro T, Yamamori H, Takagi K, Hayashi N, Furukawa K, Nakajima N, et al. n-3 versus n-6 polyunsaturated fatty acids in critical illness. Nutrition 1998;14:551-3. ArticlePubMed
- 11. Simopoulos AP. The importance of the ratio of omega-6/omega-3 essential fatty acids. Biomed Pharmacother 2002;56:365-79. ArticlePubMed
- 12. Schmitz G, Ecker J. The opposing effects of n-3 and n-6 fatty acids. Prog Lipid Res 2008;47:147-55. ArticlePubMed
- 13. Kumpf VJ. Parenteral nutrition-associated liver disease in adult and pediatric patients. Nutr Clin Pract 2006;21:279-90. ArticlePubMedPDF
- 14. Lin MT, Yeh SL, Tsou SS, Wang MY, Chen WJ. Effects of parenteral structured lipid emulsion on modulating the inflammatory response in rats undergoing a total gastrectomy. Nutrition 2009;25:115-21. ArticlePubMed
- 15. Calder PC, Jensen GL, Koletzko BV, Singer P, Wanten GJ. Lipid emulsions in parenteral nutrition of intensive care patients: current thinking and future directions. Intensive Care Med 2010;36:735-49. ArticlePubMedPMC
- 16. Mori K, Yamagata Y, Wada I, Shimizu N, Nomura S, Seto Y, et al. Robotic-assisted totally transhiatal lymphadenectomy in the middle mediastinum for esophageal cancer. J Robot Surg 2013;7:385-7. ArticlePubMedPMCPDF
- 17. Brierley JD, Gospodarowicz MK, Wittekind C. TNM classification of malignant tumours. 8th. John Wiley & Sons; 2017.
- 18. Dindo D, Demartines N, Clavien PA. Classification of surgical complications: a new proposal with evaluation in a cohort of 6336 patients and results of a survey. Ann Surg 2004;240:205-13. ArticlePubMedPMC
- 19. Meguid MM, Schimmel E, Johnson WC, Meguid V, Lowell BC, Bourinski J, et al. Reduced metabolic complications in total parenteral nutrition: pilot study using fat to replace one-third of glucose calories. JPEN J Parenter Enteral Nutr 1982;6:304-7. ArticlePubMed
- 20. Thibault R, Abbasoglu O, Ioannou E, Meija L, Ottens-Oussoren K, Pichard C, et al. ESPEN guideline on hospital nutrition. Clin Nutr 2021;40:5684-709. ArticlePubMed
- 21. Battistella FD, Widergren JT, Anderson JT, Siepler JK, Weber JC, MacColl K, et al. A prospective, randomized trial of intravenous fat emulsion administration in trauma victims requiring total parenteral nutrition. J Trauma 1997;43:52-60. ArticlePubMed
- 22. McCowen KC, Friel C, Sternberg J, Chan S, Forse RA, Burke PA, et al. Hypocaloric total parenteral nutrition: effectiveness in prevention of hyperglycemia and infectious complications--a randomized clinical trial. Crit Care Med 2000;28:3606-11. ArticlePubMed
- 23. Hynes O, Anandavadivelan P, Gossage J, Johar AM, Lagergren J, Lagergren P, et al. The impact of pre- and post-operative weight loss and body mass index on prognosis in patients with oesophageal cancer. Eur J Surg Oncol 2017;43:1559-65. ArticlePubMed
References
Figure & Data
REFERENCES
Citations
Citations to this article as recorded by 
 Cite
Cite- Figure
-
- Related articles
-
- Peripheral vein infusions of amino acids prevent early postoperative weight loss after robot-assisted radical transmediastinal esophagectomy: a retrospective study in Japan
- Association between decreased dietary intake during hospitalization and long-term weight loss in postoperative gastric cancer patients over 75 years of age: a retrospective cohort study
- Comparison of efficacy of enteral versus parenteral nutrition in patients after esophagectomy in Malaysia: a prospective cohort study
Association of soy oil-based lipid injectable emulsion with early body weight loss after minimally invasive esophagectomy in Japan: a retrospective cohort study
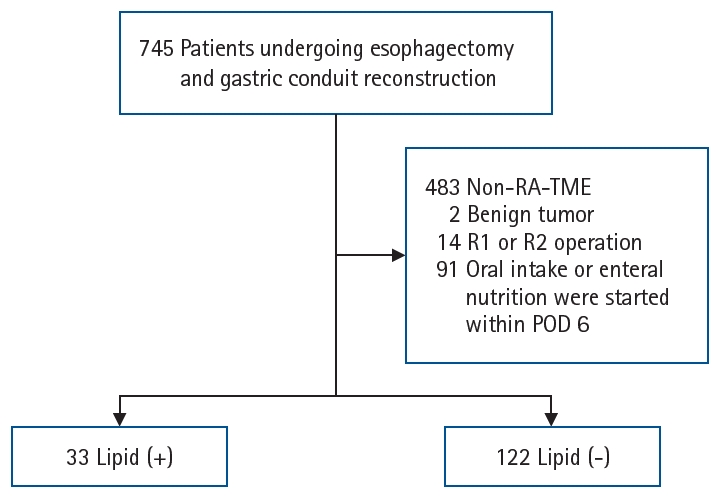

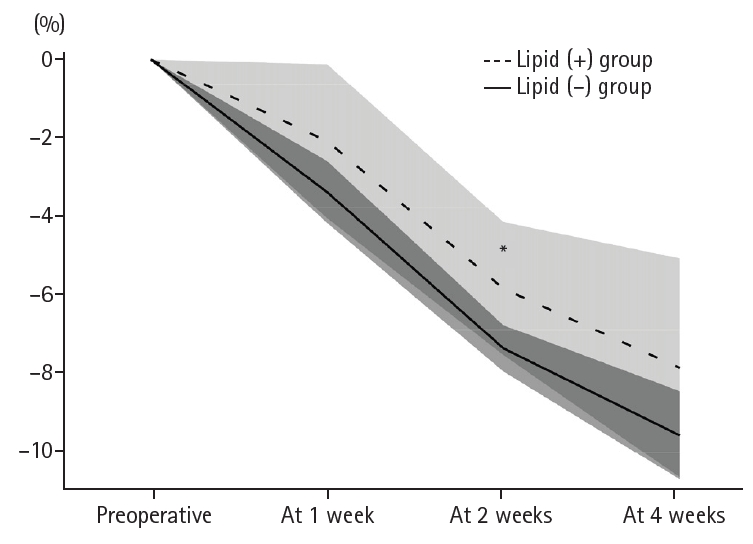

Fig. 1. Flow diagram of patient enrollment. Among 262 patients who underwent robot-assisted radical transmediastinal esophagectomy (RA-TME), 155 who received neither oral nor enteral nutrition by postoperative day (POD) 6 were included and classified according to whether they received peripheral parenteral nutrition with soy oil-based lipid injectable emulsion during this period.
Fig. 2. Postoperative nutritional components. Total administered amounts of energy (A), lipid (B), and amino acids plus protein (C) were compared between the two groups from postoperative day (POD) 1 to POD 14. Data are presented as mean±standard deviation. *P-values <0.05 compared with the lipid (–) group at each time point (linear mixed-effects models).
Fig. 3. Postoperative body weight change. Mean percentage change in body weight from baseline over time in the lipid (+) and lipid (–) groups, presented as mean±confidence interval. *P-values <0.05 compared with the lipid (–) group at each time point (linear mixed-effects models).
Graphical abstract
Fig. 1.
Fig. 2.
Fig. 3.
Graphical abstract
Association of soy oil-based lipid injectable emulsion with early body weight loss after minimally invasive esophagectomy in Japan: a retrospective cohort study
| Variable | Lipid (+) group (n=33) | Lipid (–) group (n=122) | P-value |
|---|---|---|---|
| Sex | 0.246 | ||
| Male | 26 (78.8) | 106 (86.9) | |
| Female | 7 (21.2) | 16 (13.1) | |
| Age (yr) | 68.0 (61.0–74.0) | 67.5 (60.0–73.0) | 0.627 |
| ≥75 | 7 (21.2) | 23 (18.9) | 0.761 |
| Height (cm) | 165.2 (160.1–169.9) | 166.5 (161.1–170.3) | 0.820 |
| Body weight (kg) | 59.2 (53.6–66.1) | 61.7 (53.9–67.9) | 0.266 |
| BMI (kg/m2) | 21.1 (19.4–23.8) | 22.0 (20.1–23.8) | 0.188 |
| Obesity (≥25) | 5 (15.2) | 18 (14.8) | 0.955 |
| Underweight (≤18.5) | 7 (21.2) | 14 (11.5) | 0.147 |
| Muscle mass (kg) | 45.1 (38.0–47.8) | 46.5 (42.2–49.9) | 0.118 |
| Body fat percentage (%) | 20.2 (14.7–25.6) | 19.4 (15.8–23.4) | 0.850 |
| SPPB score | 12 (12–12) | 12 (11–12) | 0.453 |
| SPPB score | 0.147 | ||
| ≤9 points | 2 (7.7) | 2 (2.0) | |
| ≥10 points | 24 (92.3) | 96 (98.0) | |
| SMI (kg/m2) | 7.3 (6.3–7.8) | 7.5 (6.8–8.1) | 0.145 |
| Low SMI | 10 (30.3) | 22 (18.0) | 0.076 |
| Sarcopenia | 6 (23.1) | 14 (13.7) | 0.241 |
| Preoperative chemotherapy | 13 (39.4) | 67 (54.9) | 0.113 |
| ASA-PS | 0.485 | ||
| I or II | 29 (87.9) | 112 (91.8) | |
| III | 4 (12.1) | 10 (8.2) | |
| White blood cells (/μL) | 6,500 (5,000–8,050) | 6,300 (5,000–7,725) | 0.873 |
| Neutrophils (/μL) | 4,543 (3,231–6,232) | 4,165 (3,239–5,201) | 0.528 |
| Lymphocytes (/μL) | 1,341 (1,079–1,578) | 1,477 (1,223–1,727) | 0.101 |
| Hemoglobin (g/dL) | 11.3 (10.1–13.4) | 12.4 (10.4–13.7) | 0.211 |
| Serum albumin (g/dL) | 4.0 (3.6–4.3) | 3.9 (3.7–4.1) | 0.825 |
| AST (U/L) | 21.0 (17.5–26.5) | 19.0 (16.0–22.0) | 0.048 |
| ALT (U/L) | 13.0 (11.0–17.5) | 14.0 (10.0–18.0) | 0.948 |
| γ-GTP (U/L) | 33.5 (21.3–49.3) | 26.0 (20.5–39.0) | 0.215 |
| Total bilirubin (mg/dL) | 0.5 (0.4–0.7) | 0.6 (0.4–0.7) | 0.678 |
| CRP (mg/dL) | 0.09 (0.04–0.27) | 0.07 (0.03–0.19) | 0.226 |
| NLR | 3.3 (2.5–4.9) | 2.8 (2.2–4.1) | 0.053 |
| PNI | 45.9 (42.4–48.5) | 46.9 (43.7–48.9) | 0.417 |
| Variable | Lipid (+) group (n=33) | Lipid (–) group (n=122) | P-value |
|---|---|---|---|
| Operation time (min) | 419 (365–458) | 434 (383–482) | 0.064 |
| Intraoperative blood loss (mL) | 160 (60–225) | 180 (90–370) | 0.057 |
| Lymphadenectomy | 0.194 | ||
| Three fields | 24 (72.7) | 101 (82.8) | |
| Two fields | 9 (27.3) | 21 (17.2) | |
| Reconstruction route | 0.643 | ||
| Posterior mediastinal route | 32 (97.0) | 116 (95.1) | |
| Non-posterior mediastinal route | 1 (3.0) | 6 (4.9) |
| Variable | Lipid (+) group (n=33) | Lipid (–) group (n=122) | P-value |
|---|---|---|---|
| Postoperative complications |
|||
| CD grade ≥II | 19 (57.6) | 69 (56.6) | 0.917 |
| CD grade ≥III | 10 (30.3) | 31 (25.4) | 0.572 |
| Pneumonia | 7 (21.2) | 18 (14.8) | 0.371 |
| Anastomotic leakage | 8 (24.2) | 19 (15.6) | 0.244 |
| Superficial surgical site infection | 3 (9.1) | 6 (4.9) | 0.363 |
| Postoperative hospital stay (day) | 22 (16–33) | 18 (17–26) | 0.774 |
| Pathological T factor | 0.672 | ||
| pT1 or 2 | 22 (66.7) | 86 (70.5) | |
| pT3 or 4 | 11 (33.3) | 36 (29.5) | |
| Lymph node metastasis | 20 (60.6) | 56 (45.9) | 0.134 |
| Presence | 13 (39.4) | 66 (54.1) | |
| Absence | |||
| Pathological stage | 0.453 | ||
| pStage I | 9 (27.3) | 47 (38.5) | |
| pStage II | 5 (15.2) | 24 (19.7) | |
| pStage III | 15 (45.5) | 40 (32.8) | |
| pStage IV | 4 (12.1) | 11 (9.0) |
| Group main effect (95% CI) | P-value | Timexgroup interaction, F (df) | P-value | Time-point contrasts | |||
|---|---|---|---|---|---|---|---|
| Time-point | Estimate (95% CI) | P-value | |||||
| White blood cells (/μL) | –398 (–764 to –33) | 0.033 | 1.31 (3,430) | 0.269 | |||
| Neutrophils (/μL) | –479 (–826 to –132) | 0.007 | 1.04 (3,426) | 0.375 | |||
| Lymphocytes (/μL) | 51 (–19 to 122) | 0.150 | 0.72 (3,419) | 0.540 | |||
| Hemoglobin (g/dL) | 0.1 (–0.2 to 0.3) | 0.604 | 1.56 (3,423) | 0.197 | |||
| Serum albumin (g/dL) | 0.0 (–0.0 to 0.1) | 0.248 | 1.31 (3,428) | 0.268 | |||
| AST (U/L) | –0.1 (–1.8 to 1.7) | 0.941 | 2.19 (3,425) | 0.089 | Week 1 | 1.5 (–0.6 to 3.6) | 0.159 |
| ALT (U/L) | 0.9 (–3.2 to 5.0) | 0.660 | 0.49 (3,427) | 0.686 | |||
| γ-GTP (U/L) | –14 (–26 to –3) | 0.180 | 2.35 (3,402) | 0.072 | Week 2 | –11 (–22 to 0) | 0.053 |
| Total bilirubin (mg/dL) | –0.0 (–0.1 to 0.1) | 0.862 | 0.58 (3,392) | 0.630 | |||
| CRP (mg/dL) | –0.7 (–1.1 to –0.3) | 0.002 | 2.78 (3,433) | 0.041 | Week 2 | –0.5 (–1.0 to 0.0) | 0.069 |
| NLR | –1.1 (–1.8 to –0.4) | 0.003 | 2.11 (3,425) | 0.098 | Week 1 | –0.5 (–1.2 to 0.1) | 0.086 |
| PNI | 0.6 (–0.2 to 1.3) | 0.132 | 0.33 (3,426) | 0.805 | |||
| Variable | PBWL in 2 wk RA-TME, No. (%) | P-value | |
|---|---|---|---|
| ≥5% (n=106) | <5% (n=31) | ||
| Sex | 0.093 | ||
| Male | 92 (86.8) | 23 (74.2) | |
| Female | 14 (13.2) | 8 (25.8) | |
| Age ≥75 yr | 20 (18.9) | 9 (29.0) | 0.223 |
| BMI (kg/m2) | |||
| Obesity (≥25) | 17 (16.0) | 5 (16.1) | 0.990 |
| Underweight (≤18.5) | 12 (11.3) | 6 (19.4) | 0.244 |
| Preoperative chemotherapy | 52 (49.1) | 12 (38.7) | 0.310 |
| ASA-PS | 0.059 | ||
| I or II | 100 (94.3) | 26 (83.9) | |
| III | 6 (5.7) | 5 (16.1) | |
| Lymphadenectomy | 0.327 | ||
| Three fields | 22 (20.8) | 4 (12.9) | |
| Two fields | 84 (79.2) | 27 (87.1) | |
| Reconstruction route | 0.218 | ||
| Posterior mediastinal route | 101 (95.3) | 31 (100.0) | |
| Non-posterior mediastinal route | 5 (4.7) | 0 | |
| Pneumonia | 16 (15.1) | 6 (19.4) | 0.570 |
| Anastomotic leakage | 21 (19.8) | 5 (16.1) | 0.646 |
| Superficial surgical site infection | 7 (6.6) | 2 (6.5) | 0.976 |
| Pathological T factor | 0.785 | ||
| pT1 or 2 | 30 (28.3) | 8 (25.8) | |
| pT3 or 4 | 76 (71.7) | 23 (74.2) | |
| Lymph node metastasis | 0.349 | ||
| Presence | 48 (45.3) | 17 (54.84) | |
| Absence | 58 (54.7) | 14 (45.16) | |
| Postoperative complications |
|||
| CD grade ≥II | 62 (58.5) | 20 (64.5) | 0.547 |
| CD grade ≥III | 29 (27.4) | 10 (32.3) | 0.595 |
| Lipid use | 19 (17.9) | 11 (35.5) | 0.038 |
| Amino acid use | 45 (42.5) | 18 (58.1) | 0.125 |
| Total energy until POD 6 ≥3,000 kcal | 34 (32.1) | 14 (45.2) | 0.179 |
| Multivariate analysis | ||
|---|---|---|
| OR (95% CI) | P-value | |
| Lipid-free PN | 2.22 (0.89–5.57) | 0.088 |
| Male sex | 2.12 (0.76–5.88) | 0.150 |
| ASA ≤2 | 2.93 (0.78–10.97) | 0.110 |
Table 1. Patients’ characteristics
Values are presented as number (%) or median (interquartile range). SPPB scores and number of sarcopenia include missing values. BMI, body mass index; SPPB, Short Physical Performance Battery; SMI, skeletal muscle index; ASA-PS, American Society of Anesthesiologists Physical Status classification; AST, aspartate aminotransferase; ALT, alanine aminotransferase; γ-GTP, γ-glutamyl transpeptidase; CRP, C-reactive protein; NLR, neutrophil-to-lymphocyte ratio; PNI, prognostic nutritional index.
Table 2. Surgical outcomes
Values are presented as median (interquartile range) or number (%).
Table 3. Postoperative short-term and pathological outcomes
Values are presented as number (%) or median (interquartile range). Clavien-Dindo classification (CD) reflects the highest-grade complication per patient.
Table 4. Linear mixed-effects models of postoperative hematological findings (lipid (–) group vs. lipid (+) group)
CI, confidence interval; AST, aspartate aminotransferase; ALT, alanine aminotransferase; γ-GTP, γ-glutamyl transpeptidase; CRP, C-reactive protein; NLR, neutrophil-to-lymphocyte ratio; PNI, prognostic nutritional index.
Table 5. PBWL in the first 2 weeks after RA-TME
PBWL, postoperative body weight loss; RA-TME, robot-assisted radical transmediastinal esophagectomy; BMI, body mass index; ASA-PS, the American Society of Anesthesiologists Physical Status classification; CD, Clavien-Dindo classification; POD, postoperative day. CD reflects the highest-grade complication per patient.
Table 6. Logistic regression analysis of risk factors for the rate of PBWL in 2 weeks after RA-TME ≥5%
PBWL, postoperative body weight loss; RA-TME, robot-assisted radical transmediastinal esophagectomy; OR, odds ratio; CI, confidence interval; PN, parenteral nutrition; ASA, American Society of Anesthesiologists.

