 E-submission
Indexed in:
Scopus, KCI, KoreaMed
Scopus, KCI, KoreaMed

Articles
- Page Path
- HOME > Ann Clin Nutr Metab > Volume 18(1); 2026 > Article
- Original Article Association between the calcium-to-phosphorus ratio and early hypophosphatemia in preterm infants receiving parenteral nutrition in Korea: a retrospective cohort study
-
Miseon Han1
 , Jin Ok Kyun1, Yoong-A Suh2, Jang Hoon Lee2
 -
Annals of Clinical Nutrition and Metabolism 2026;18(1):44-53.
DOI: https://doi.org/10.15747/ACNM.25.0039
Published online: March 17, 2026
1Department of Pharmacy, Ajou University Hospital, Suwon, Korea
2Department of Pediatrics, Ajou University Hospital, Ajou University School of Medicine, Suwon, Korea
- Corresponding author: Jin Ok Kyun, e-mail: kyjinok@aumc.ac.kr
• Received: November 11, 2025 • Revised: January 7, 2026 • Accepted: January 26, 2026
© 2026 The Korean Society of Surgical Metabolism and Nutrition · The Korean Society for Parenteral and Enteral Nutrition · Asian Society of Surgical Metabolism and Nutrition
This is an Open Access article distributed under the terms of the Creative Commons Attribution Non-Commercial License (http://creativecommons.org/licenses/by-nc/4.0), which permits unrestricted non-commercial use, distribution, and reproduction in any medium, provided the original work is properly cited.
- 1,839 Views
- 31 Download
Abstract
-
Purpose This study aimed to evaluate the association between the calcium-to-phosphorus (Ca/P) ratio and serum phosphate levels in preterm infants receiving total parenteral nutrition (TPN) and to explore Ca/P ratio ranges associated with hypophosphatemia.
-
Methods We retrospectively reviewed the medical records of preterm infants admitted to the neonatal intensive care unit at Ajou University Hospital between January 2022 and June 2024. The review focused on TPN composition and serum electrolyte changes during the first week of life. Based on the cumulative Ca/P ratio during this period, infants were categorized into two groups: Ca/P-Low (mass ratio ≤1.3) and Ca/P-High (mass ratio >1.3).
-
Results A total of 117 preterm infants were included in the analysis (Ca/P-Low group, n=46; Ca/P-High group, n=71). During the first week of life, the cumulative phosphorus deficit was significantly greater in the Ca/P-High group (61.4 mg/kg vs. 8.5 mg/kg; P<0.001). By day of life (DOL) 7, both hypophosphatemia and severe hypophosphatemia had increased markedly in the Ca/P-High group compared with DOL 3. In the Ca/P-High group, the incidence of hypophosphatemia increased from 44.4% on DOL 3 to 75.0% on DOL 7, while the incidence of severe hypophosphatemia increased from 4.8% to 23.1%.
-
Conclusion These findings suggest that parenteral nutrition strategies may benefit from phase-adapted Ca/P ratios rather than a fixed ratio during the first week of life. A higher ratio may be considered during DOL 0–2, whereas a lower ratio may be considered during DOL 3–6, particularly when overall calcium and phosphorus supply is suboptimal.
Graphical abstract
Introduction
Very low birth weight preterm infants, including those who are small for gestational age (SGA), often have inadequate nutrient stores as a result of prematurity, placental insufficiency, or impaired intrauterine growth [1,2]. Total parenteral nutrition (TPN) is essential to prevent nutrient deficiencies in very low birth weight preterm infants. However, early aggressive TPN may predispose physiologically immature and vulnerable infants to refeeding syndrome, which is characterized by hypophosphatemia during the first days of life [2-7].
When nutritional support is initiated after birth in undernourished infants, metabolism shifts toward cellular anabolism and is accompanied by increased insulin secretion. By stimulating ATPase activity, insulin enhances ATP production, which markedly increases cellular phosphate demand. If adequate phosphate is not supplied, this increased demand may lead to rapid depletion of intracellular and extracellular phosphate stores [1,2,8]. In the presence of intracellular phosphate deficiency, this transcellular shift can result in pronounced acute hypophosphatemia [6,9].
Phosphorus is essential for ATP synthesis, acid-base buffering, and the function of numerous enzymes [1,10,11]. Consequently, phosphorus deficiency may lead not only to critical cellular dysfunction but also to increased insulin resistance, sepsis, neurodevelopmental impairment, chronic lung disease, and mortality [1,3,4,6,7,11,12]. These risks are of particular concern in preterm infants, whose gastrointestinal and renal capacities for calcium and phosphate absorption are immature [7,13,14].
The ESPGHAN/ESPEN/ESPR/CSPEN guidelines recommend supplying calcium at 32–80 mg/kg and phosphate at 31–62 mg/kg during the first days of life, with a molar calcium-to-phosphorus (Ca/P) ratio of 0.8–1.0 (equivalent to a mass ratio of 1.0–1.3) to prevent early hypophosphatemia [15]. However, fluid restriction is often required in preterm infants with cardiac or pulmonary conditions, making it difficult to provide adequate calcium and phosphate without precipitation [13].
Therefore, this study aimed to evaluate the association between guideline-recommended Ca/P ratios and hypophosphatemia, particularly in clinical settings where calcium and phosphate intake is relatively suboptimal. We also examined the relationship between cumulative phosphorus deficit and serum phosphate levels and assessed potential threshold values associated with hypophosphatemia.
Methods
Ethics approval for this study was obtained from the Institutional Review Board (IRB) of Ajou University Hospital, Suwon, Korea (No. IRB-DB-2024-367). The requirement for written informed consent was waived by the IRB.
This was a single-center retrospective cohort study with repeated outcome assessments during early life.
We retrospectively reviewed the medical records of preterm infants admitted to the neonatal intensive care unit at Ajou University Hospital between January 2022 and June 2024.
Nutrition protocol
TPN was initiated within 24–36 hours after birth. On the first day of TPN, only calcium was added to the TPN solution at a typical dose of 30–40 mg/kg/day, whereas other electrolytes were withheld. Calcium and phosphate were provided as 10% calcium gluconate and monobasic potassium phosphate, respectively. Because the phosphate preparation contains potassium, phosphate administration was restricted during day of life (DOL) 0–2 when elevated potassium levels or decreased ionized calcium levels were noted on capillary blood gas analysis. Enteral nutrition was initiated with breast milk or preterm formula at 10–20 mL/kg/day as tolerated, and TPN was discontinued once enteral nutrition provided 70%–80% of energy requirements.
Among infants who received TPN within 24–36 hours after birth, those with a gestational age of <32 weeks or a birth weight of <1,500 g were included in this study. Infants were excluded if they discontinued TPN within 72 hours after birth, died within the first week of life, received peripheral TPN, had major congenital anomalies, or required resuscitation at birth. Based on the cumulative parenteral supply of calcium and phosphate during the first week of life, the infants were divided into two groups: the Ca/P-Low group (mass ratio ≤1.3) and the Ca/P-High group (mass ratio >1.3).
The primary exposure variable was the Ca/P ratio in parenteral nutrition administered during the first week of life. Infants were categorized into two groups according to this ratio: those receiving a low ratio (≤1.3) and those receiving a high ratio (>1.3). The primary outcome variables were hypophosphatemia, defined as a serum phosphate level of <4.5 mg/dL, and severe hypophosphatemia, defined as a level of <3.0 mg/dL [9], measured on DOL 3 and DOL 7. Prespecified covariates included gestational age, birth weight, SGA, and the total amounts of calcium and phosphorus received from both parenteral and enteral nutrition during the first 3 days (DOL 0–2).
Electrolytes were monitored daily using capillary blood gas analysis. On DOL 3 and DOL 7, however, comprehensive metabolic panels were performed instead. Because phosphate levels were measured only in the comprehensive metabolic panels, total serum calcium levels were used for the analysis. Based on the capillary blood gas and comprehensive metabolic panel results obtained early each morning, TPN was revised and administered beginning at 2 p.m. on the same day. Accordingly, laboratory results on DOL 3 were assumed to reflect TPN administered during DOL 0–2, whereas results on DOL 7 were assumed to reflect TPN administered during DOL 3–6. Missing outcome data were primarily attributable to discontinuation of TPN before the relevant time point or to the absence of scheduled laboratory testing on that day. Analyses at each time point were therefore performed using a complete-case approach.
Phosphorus requirements were estimated using the following formula, which accounts for amino acid and calcium intake [10]:
P (mg/kg/day) = Ca (mg/kg/day) / 2.15 + (amino acid [g/kg/day] – 1.3) × 0.8 × 12.3
The phosphorus deficit was calculated by subtracting the actual amount supplied via TPN from the estimated requirement derived from this formula. A positive value indicated a deficit, whereas a negative value indicated an excess.
To minimize selection bias, we included all eligible preterm infants who received parenteral nutrition within 24–36 hours after birth throughout the study period. Exposure and outcomes were defined a priori using standardized prescription records and laboratory assays. Confounding was mitigated through prespecified covariate adjustment.
The study size was determined by the number of infants who met the inclusion criteria within the predefined period; therefore, a formal a priori power calculation was not performed. To maximize precision, all eligible infants were included. The sample yielded a sufficient number of outcome events to support multivariable modeling (with at least 10 events per parameter) and subgroup analyses.
Continuous variables were analyzed using the independent t-test or the Mann-Whitney U test, whereas categorical variables were analyzed using the chi-square test or Fisher exact test, as appropriate. Multivariable logistic regression was performed to identify factors associated with early hypophosphatemia on DOL 3. The model was adjusted for gestational age, birth weight, SGA, and total phosphorus and calcium intakes during DOL 0–2. Calcium and phosphorus intakes were entered separately rather than as the Ca/P ratio to avoid multicollinearity. Linear regression analysis was performed to evaluate the association between cumulative phosphorus deficit and serum calcium and phosphate levels. The predictive value of cumulative phosphorus deficit for hypophosphatemia occurring at any time during the first week of life was assessed using receiver operating characteristic (ROC) curve analysis. The association between severe hypophosphatemia and complications in preterm infants was evaluated using logistic regression analysis. All statistical analyses were performed using SPSS Statistics version 29.0.2.0 (IBM Corp.), and a P-value of <0.05 was considered statistically significant.
Results
A total of 166 preterm infants with a gestational age of <32 weeks or a birth weight of <1,500 g who received parenteral nutrition after birth were initially enrolled. Of these, 37 infants who received peripheral TPN, five who died within 7 days after birth, four who discontinued TPN within 72 hours after birth, and three who had congenital anomalies or required immediate resuscitation after birth were excluded. Thus, 117 infants were included in the final analysis and divided into two groups according to the Ca/P ratio: the Ca/P-Low group (mass ratio ≤1.3; n=46) and the Ca/P-High group (mass ratio >1.3; n=71) (Supplement 1). Although most variables did not differ significantly between the two groups, the Ca/P-Low group had a significantly higher proportion of SGA infants (15.2% vs. 5.6%; P=0.026) and a higher incidence of culture-proven sepsis (21.7% vs. 5.6%; P=0.009) than the Ca/P-High group (Table 1).
We analyzed nutritional support provided through TPN and enteral nutrition during the first week of life by dividing the period into two phases: DOL 0–2 and DOL 3–6 (Table 2). Although enteral nutrition was administered concurrently, the Ca/P ratio of parenteral nutrition was selected as the primary exposure variable because the Ca/P ratio of enteral nutrition is fixed. There were no significant differences between the two groups in the amounts of fluid, calories, amino acids, glucose, or lipids administered during either phase. In the early phase (DOL 0–2), calcium intake was higher in the Ca/P-High group (36.0 mg/kg/day vs. 30.0 mg/kg/day; P=0.019), whereas phosphorus intake was minimal in both groups, resulting in substantial phosphorus deficits (20.8 mg/kg/day vs. 18.1 mg/kg/day; P=0.011). In the later phase (DOL 3–6), calcium intake remained higher in the Ca/P-High group (15.6 mg/kg/day vs. 6.0 mg/kg/day; P<0.001), whereas phosphorus intake was significantly greater in the Ca/P-Low group (24.8 mg/kg/day vs. 15.5 mg/kg/day; P<0.001). Accordingly, the phosphorus deficit declined to –3.7 mg/kg/day in the Ca/P-Low group and 6.2 mg/kg/day in the Ca/P-High group (P<0.001). Consequently, the cumulative phosphorus deficit during the first week of life was significantly greater in the Ca/P-High group than in the Ca/P-Low group (61.4 mg/kg vs. 8.5 mg/kg; P<0.001).
Of the 117 eligible infants, serum phosphate measurements were available for 102 on DOL 3 and 81 on DOL 7 (Table 3). On DOL 3, the Ca/P-Low group had a significantly lower mean serum phosphate level than the Ca/P-High group (3.7±1.4 mg/dL vs. 4.7±1.1 mg/dL; P<0.001), and the mean value in the Ca/P-Low group was within the hypophosphatemic range. Consistent with this finding, the incidences of both hypophosphatemia and severe hypophosphatemia were significantly higher in the Ca/P-Low group (79.5% vs. 44.4%; P=0.002 and 28.2% vs. 4.8%; P=0.003). On DOL 7, however, the mean serum phosphate level increased to 4.0 mg/dL in the Ca/P-Low group and decreased to 3.9 mg/dL in the Ca/P-High group, with no significant difference between the groups (P=0.965). Both values remained within the hypophosphatemic range. Compared with DOL 3, the incidence of hypophosphatemia decreased slightly in the Ca/P-Low group but increased markedly in the Ca/P-High group, with no significant between-group difference (65.5% vs. 75.0%; P=0.050). Although the incidence of severe hypophosphatemia remained higher in the Ca/P-Low group (34.5% vs. 23.1%; P=0.041), the increase over time was greater in the Ca/P-High group. Serum calcium and albumin levels measured on DOL 3 and DOL 7 did not differ significantly between the two groups.
Multivariable logistic regression analysis showed that higher early calcium intake and lower birth weight were associated with early hypophosphatemia on DOL 3. Gestational age, SGA, and phosphorus intake were not significantly associated with the outcome (Table 4).
The relationship between cumulative phosphorus deficit during the first week of life and serum calcium and phosphate levels was analyzed using linear regression (Fig. 1). Cumulative phosphorus deficit was positively correlated with serum calcium levels (r2=0.204) and negatively correlated with serum phosphate levels (r2=0.089), indicating that greater phosphorus deficits were associated with higher serum calcium and lower serum phosphate levels (both P<0.001). To further illustrate the intake imbalance underlying these associations, the distribution of the Ca/P mass ratio cutoff used for group classification is shown in Supplement 2. ROC curve analysis of cumulative phosphorus deficit for hypophosphatemia during the first week of life yielded an area under the ROC curve (AUC) of 0.694 (95% confidence interval, 0.625–0.763; P<0.001). A cutoff value of 36.1 mg/kg was identified, with a sensitivity of 61.4% and a specificity of 74.2% (Fig. 2).
In this study, severe hypophosphatemia was associated with higher odds of culture-proven sepsis (odds ratio [OR]=3.95), intraventricular hemorrhage (IVH) (OR=4.60), and rickets (OR=2.99). No significant associations were observed with necrotizing enterocolitis, retinopathy of prematurity, bronchopulmonary dysplasia, nephrocalcinosis, or mortality (Table 5).
Discussion
Infants in the Ca/P-High group experienced a significantly greater phosphorus deficit over time than those in the Ca/P-Low group (61.4 mg/kg vs. 8.5 mg/kg). By DOL 3, the Ca/P-Low group had a higher incidence of hypophosphatemia than the Ca/P-High group, with 79.5% affected versus 44.4%. Severe hypophosphatemia was also more prevalent in the Ca/P-Low group (28.2% vs. 4.8%). However, by DOL 7, this pattern had shifted in the Ca/P-High group, in which the prevalence of hypophosphatemia increased markedly to 75.0% and severe hypophosphatemia increased to 23.1%. A greater phosphorus deficit was associated with a corresponding decrease in serum phosphate levels. Severe hypophosphatemia was associated with culture-proven sepsis, IVH (grade ≥3), and rickets.
In neonatal parenteral nutrition, calcium and phosphorus administration is constrained by solubility, such that increasing phosphorus provision often necessitates a reduction in calcium. However, because placental calcium transfer ceases at birth and hormonal regulation remains immature, preterm infants are susceptible to early hypocalcemia. Consequently, concerns regarding calcium homeostasis often lead to calcium-dominant supplementation during the early postnatal period, which limits phosphorus provision and results in a high Ca/P ratio, thereby increasing the risk of progressive phosphorus depletion [13,15].
Because baseline serum phosphate levels immediately after birth were not available, the potential influence of preexisting phosphate status on early hypophosphatemia cannot be completely excluded. Therefore, we evaluated factors associated with hypophosphatemia using the earliest available serum phosphate measurement on DOL 3. Lower birth weight was associated with early hypophosphatemia on DOL 3. However, although infants in the Ca/P-Low group tended to have lower birth weight and a higher frequency of SGA, these factors alone do not fully explain the higher incidence of hypophosphatemia. After adjustment for gestational age, birth weight, SGA, and phosphorus intake, higher early calcium intake remained associated with early hypophosphatemia. These findings suggest that relatively high calcium exposure during early life may contribute to phosphate depletion during the first days of life.
This temporal pattern may, in part, reflect clinical decision-making that prioritized phosphorus supplementation while relatively reducing calcium intake during DOL 3–6. The direction of the association differed by time point: the Ca/P-Low group showed lower phosphate levels on DOL 3, whereas the Ca/P-High group showed greater deterioration from DOL 3 to DOL 7, consistent with a larger cumulative deficit. Although the absolute incidence of severe hypophosphatemia on DOL 7 remained higher in the Ca/P-Low group, the increase over time was more pronounced in the Ca/P-High group.
In the Ca/P-Low group, the mean serum phosphate level on DOL 3 was lower than that in the Ca/P-High group. However, with relatively greater phosphate intake (mass ratio, 0.24) during DOL 3–6, the Ca/P-Low group showed an increasing trend in serum phosphate levels by DOL 7, although the mean level remained within the hypophosphatemic range. Conversely, in the Ca/P-High group, calcium and phosphorus were administered at a mass ratio of 1.0 during DOL 3–6. As a result, serum phosphate levels, which were within the normal range on DOL 3, decreased to the hypophosphatemic range on DOL 7, accompanied by a marked increase in the incidence of both hypophosphatemia and severe hypophosphatemia.
In this study, among the total study population, the incidence of hypophosphatemia was 57.8% and that of severe hypophosphatemia was 13.7% on DOL 3; by DOL 7, these incidences had increased to 71.6% and 27.2%, respectively. These findings indicate a downward trend in serum phosphate levels between DOL 3 and DOL 7, which is consistent with previous reports. In the study by Pajak et al. [4], phosphate was administered via TPN, usually starting on DOL 3 (range, DOL 2–5), which was similar to the protocol used in our study. Among preterm infants who received parenteral nutrition for more than 3 days, 66% showed a downward trend in serum phosphate levels, and this decline was observed up to DOL 10 (median, DOL 6). These findings suggest that hypophosphatemia may occur frequently in preterm infants during the first week of life, highlighting the potential need for more aggressive phosphate supplementation during this period.
Greater cumulative phosphorus deficits were associated with lower serum phosphate levels, and deficits exceeding 36.1 mg/kg were associated with a higher risk of hypophosphatemia. This is consistent with the finding that the Ca/P-High group, which had a cumulative phosphorus deficit of 61.4 mg/kg during the first week of life, showed a decline in serum phosphate levels between DOL 3 and DOL 7, accompanied by a higher incidence of hypophosphatemia and severe hypophosphatemia.
Given the similar parenteral amino acid provision across groups, the cumulative phosphorus deficit in this cohort primarily reflected differences in calcium-phosphorus balance. However, amino acid intake remains an important determinant when estimating the Ca/P ratios required to maintain phosphorus balance. Assuming that the threshold value of 36.1 mg/kg was evenly distributed over the first week of life, we derived a daily phosphorus deficit limit of 5.2 mg/kg/day and used the formula described in the Methods to estimate the range of Ca/P ratios required to maintain phosphorus balance. With calcium supplementation of 30–40 mg/kg/day, the estimated Ca/P mass ratio ranged from 1.4 to 2.0 at an amino acid intake of 2 g/kg/day and decreased to 1.0–1.3 at 3 g/kg/day. However, when these estimates were applied to the actual nutritional intakes observed in this study during DOL 3–6 with an amino acid intake of 3 g/kg/day, the Ca/P ratio was calculated to be approximately 0.3–0.4 for the Ca/P-Low group (calcium, 6 mg/kg/day) and 0.6–0.8 for the Ca/P-High group (calcium, 15.6 mg/kg/day). These findings are consistent with the report by Spath et al. [16], which noted that a lower Ca/P ratio and a relatively higher phosphorus-to-amino acid ratio were associated with the prevention of severe hypophosphatemia. This interpretation is further supported by the observation that, during DOL 3–6, calcium and phosphorus were supplied at a mass ratio of 0.24 in the Ca/P-Low group, which was below the calculated theoretical ratio of 0.3–0.4, resulting in partial correction of serum phosphate levels by DOL 7. In contrast, in the Ca/P-High group, a higher ratio of 1.0, which exceeded the calculated theoretical ratio of 0.6–0.8, was supplied during the same period, leading to a decrease in serum phosphate levels by DOL 7.
Overall, a Ca/P mass ratio of approximately 1.4–2.0 may be appropriate during DOL 0–2, when amino acid intake remains relatively low, whereas a ratio of 1.0–1.3 may be considered during DOL 3–6 as amino acid intake increases. However, given the practical difficulty of providing sufficient calcium and phosphorus in preterm infants, a somewhat lower Ca/P ratio than 1.0–1.3 may be required to mitigate the risk of hypophosphatemia.
Consistent with previous reports, this study also found that severe hypophosphatemia was significantly associated with culture-proven sepsis, IVH (grade ≥3), and rickets. However, unlike some earlier studies, no significant associations were observed with moderate-to-severe bronchopulmonary dysplasia or mortality. Nevertheless, because this study did not account for long-term nutritional support or therapeutic interventions, these findings should be interpreted with caution when evaluating the relationships between severe hypophosphatemia and prematurity-related complications.
A major strength of this study is that it compared two groups with comparable supplies of energy sources, including amino acids. This design allowed evaluation of the association between the Ca/P ratio and serum phosphate levels with less confounding from other parenteral nutrition components. These findings suggest that adjusting the Ca/P ratio according to calcium intake may be associated with a reduced risk of hypophosphatemia, including severe hypophosphatemia, which may substantially affect clinical outcomes in preterm infants.
First, this was a single-center retrospective study with a small sample size, which may limit the reliability and generalizability of the findings. In addition, although cumulative phosphorus deficit was associated with hypophosphatemia, it reflects underlying nutritional prescription patterns and showed only modest predictive performance (AUC=0.694); therefore, it should be interpreted as an exploratory rather than a definitive predictor. Likewise, the multivariable analysis, although conducted with at least 10 events per variable, may still have been affected by multicollinearity and should therefore be interpreted with caution. Consistent with previous reports by Pajak et al. [4] and Spath et al. [16], insufficient phosphorus intake contributes to the development of hypophosphatemia. In this study, because calcium and phosphorus intakes were lower than the guideline recommendations [15], the incidence of hypophosphatemia may have been relatively high, and the Ca/P ratio required for its correction may have appeared lower than expected. Therefore, further studies are needed to evaluate the effect of adjusting the Ca/P ratio according to the amounts of calcium and phosphorus supplied on the prevention and correction of hypophosphatemia in preterm infants.
The Ca/P ratio was associated with hypophosphatemia in preterm infants receiving parenteral nutrition. During DOL 0–2, when amino acid intake is relatively low, a higher Ca/P ratio may help maintain mineral balance. However, as amino acid intake increases during DOL 3–6, a lower Ca/P ratio may help reduce the risk of progressive phosphorus depletion and hypophosphatemia. These findings suggest that phase-adapted Ca/P ratios, rather than a fixed ratio throughout the first week of life, may represent a reasonable approach, particularly when overall calcium and phosphorus supply is suboptimal.
Authors’ contribution
Conceptualization: MH. Data curation: MH. Formal analysis: MH. Supervision: JOK, JHL Writing– original draft: MH, YAS. Writing–review &editing: MH, JOK, JHL. All authors read and approved the final manuscript.
Conflict of interest
The authors of this manuscript have no conflicts of interest to disclose.
Funding
None.
Data availability
Contact the corresponding author for research data availability.
Acknowledgments
None.
Supplementary materials
Supplementary materials can be found via https://doi.org/10.15747/ACNM.25.0039
Supplement 2.
Distribution of the Ca/P mass ratio using a guideline-based cutoff.
Fig. 1.

Relationship between cumulative phosphorus deficit and serum calcium and phosphate levels. Serum calcium levels showed a positive correlation (r2=0.204), whereas serum phosphate levels showed a negative correlation (r2=0.089) with cumulative phosphorus deficit. Linear regression analysis was performed.
Fig. 2.

Receiver operating characteristic (ROC) curve of cumulative phosphorus deficit for predicting hypophosphatemia during the first week of life. The optimal cutoff value was 36.1 mg/kg (sensitivity, 61.4%; specificity, 74.2%; accuracy, 66.1%). The area under the ROC curve was 0.694 (95% confidence interval [CI], 0.625–0.763; P<0.001). A P-value <0.05 was considered significant.

Table 1.
Demographic characteristics and neonatal outcomes
Values are presented as median (interquartile range ), number (%), or mean±SD.
Ca/P, calcium-to-phosphorus; SGA, small for gestational age; PROM, premature rupture of membranes; TPN, total parenteral nutrition; BPD, bronchopulmonary dysplasia; IVH, intraventricular hemorrhage; ROP, retinopathy of prematurity; VEGF, vascular endothelial growth factor; NEC, necrotizing enterocolitis; SD, standard deviation.
A P-value <0.05 was considered significant.
Table 2.
Comparison of nutritional composition according to the Ca/P ratio
Table 3.
Serum biochemical parameters on DOL 3 and 7 according to the Ca/P ratio
Values are presented as mean±SD, number (%), or median (interquartile range).
DOL, day of life; Ca/P, calcium-to-phosphorus; SD, standard deviation.
aHypophosphatemia: serum phosphate level <4.5 mg/dL.
bSevere hypophosphatemia: serum phosphate level <3.0 mg/dL.
A P-value <0.05 was considered significant.
Table 4.
Multivariable logistic regression for early hypophosphatemia on DOL 3
DOL, day of life; OR, odds ratio; CI, confidence interval; SGA, small for gestational age; P, phosphorus; PN, parenteral nutrition; EN, enteral nutrition; Ca, calcium.
The model was adjusted for gestational age, birth weight, SGA, total phosphorus and calcium intakes during DOL 0–2. Ca and phosphorus P intakes are expressed as mg/kg/day.
Table 5.
Logistic regression analysis of the association between severe hypophosphatemia and neonatal morbidities
OR, odds ratio; CI, confidence interval; BPD, bronchopulmonary dysplasia; IVH, intraventricular hemorrhage; ROP, retinopathy of prematurity; VEGF, vascular endothelial growth factor; NEC, necrotizing enterocolitis; Ca/P, calcium-to-phosphorus.
The Ca/P-Low group was used as the reference category. Estimates may be unstable due to limited events. A P-value <0.05 was considered significant.
- 1. Wright TB, Bloomfield FH, Alexander T, Cormack BE. Association between early phosphate intake and refeeding syndrome in extremely low-birth-weight infants: a retrospective cohort study. JPEN J Parenter Enteral Nutr 2025;49:460-7. ArticlePubMedPMC
- 2. Ross JR, Finch C, Ebeling M, Taylor SN. Refeeding syndrome in very-low-birth-weight intrauterine growth-restricted neonates. J Perinatol 2013;33:717-20. ArticlePubMedPDF
- 3. Cormack BE, Jiang Y, Harding JE, Crowther CA, Bloomfield FH. Neonatal refeeding syndrome and clinical outcome in extremely low-birth-weight babies: secondary cohort analysis from the ProVIDe trial. JPEN J Parenter Enteral Nutr 2021;45:65-78. ArticlePubMedPMCPDF
- 4. Pajak A, Krolak-Olejnik B, Szafranska A. Early hypophosphatemia in very low birth weight preterm infants. Adv Clin Exp Med 2018;27:841-7. ArticlePubMed
- 5. Brener Dik PH, Galletti MF, Bacigalupo LT, Fernandez Jonusas S, L Mariani G. Hypercalcemia and hypophosphatemia among preterm infants receiving aggressive parenteral nutrition. Arch Argent Pediatr 2018;116:e371-7. ArticlePubMed
- 6. Sung SI, Chang YS, Choi JH, Ho Y, Kim J, Ahn SY, et al. Increased risk of refeeding syndrome-like hypophosphatemia with high initial amino acid intake in small-for-gestational-age, extremely-low-birthweight infants. PLoS One 2019;14:e0221042.ArticlePubMedPMC
- 7. Ichikawa G, Watabe Y, Suzumura H, Sairenchi T, Muto T, Arisaka O, et al. Hypophosphatemia in small for gestational age extremely low birth weight infants receiving parenteral nutrition in the first week after birth. J Pediatr Endocrinol Metab 2012;25:317-21. ArticlePubMed
- 8. Kawamura H, Tanaka S, Uenami Y, Tani M, Ishitani M, Morii S, et al. Hypophosphatemia occurs with insulin administration during refeeding by total parenteral nutrition in rats. J Med Invest 2018;65:50-5. ArticlePubMed
- 9. Larry AG. Electrolyte and acid-base disorders. In: Kliegman RM, editor. Nelson textbook of pediatrics. 21st ed. Elsevier; 2020. p. 389-424.
- 10. Bonsante F, Iacobelli S, Latorre G, Rigo J, De Felice C, Robillard PY, et al. Initial amino acid intake influences phosphorus and calcium homeostasis in preterm infants: it is time to change the composition of the early parenteral nutrition. PLoS One 2013;8:e72880.ArticlePubMedPMC
- 11. Parramon-Teixido CJ, Gomez-Ganda L, Garcia-Palop B, Lines-Palazon M, Blanco-Grau A, Montoro-Ronsano JB, et al. The influence of parenteral protein intake on electrolyte disturbances in premature infants. An Pediatr (Engl Ed) 2021;95:139-46. ArticlePubMed
- 12. Senterre T, Abu Zahirah I, Pieltain C, de Halleux V, Rigo J. Electrolyte and mineral homeostasis after optimizing early macronutrient intakes in VLBW infants on parenteral nutrition. J Pediatr Gastroenterol Nutr 2015;61:491-8. ArticlePubMed
- 13. Chacham S, Pasi R, Chegondi M, Ahmad N, Mohanty SB. Metabolic bone disease in premature neonates: an unmet challenge. J Clin Res Pediatr Endocrinol 2020;12:332-9. ArticlePubMedPMC
- 14. Tuchman S. Disorders of mineral metabolism in the newborn. Curr Pediatr Rev 2014;10:133-41. ArticlePubMed
- 15. Mihatsch W, Fewtrell M, Goulet O, Molgaard C, Picaud JC, Senterre T, et al. ESPGHAN/ESPEN/ESPR/CSPEN guidelines on pediatric parenteral nutrition: calcium, phosphorus and magnesium. Clin Nutr 2018;37:2360-5. ArticlePubMed
- 16. Spath C, Sjostrom ES, Domellof M. Higher parenteral electrolyte intakes in preterm infants during first week of life: effects on electrolyte imbalances. J Pediatr Gastroenterol Nutr 2022;75:e53-9. ArticlePubMedPMC
References
Figure & Data
REFERENCES
Citations
Citations to this article as recorded by 
 Cite
CiteAssociation between the calcium-to-phosphorus ratio and early hypophosphatemia in preterm infants receiving parenteral nutrition in Korea: a retrospective cohort study
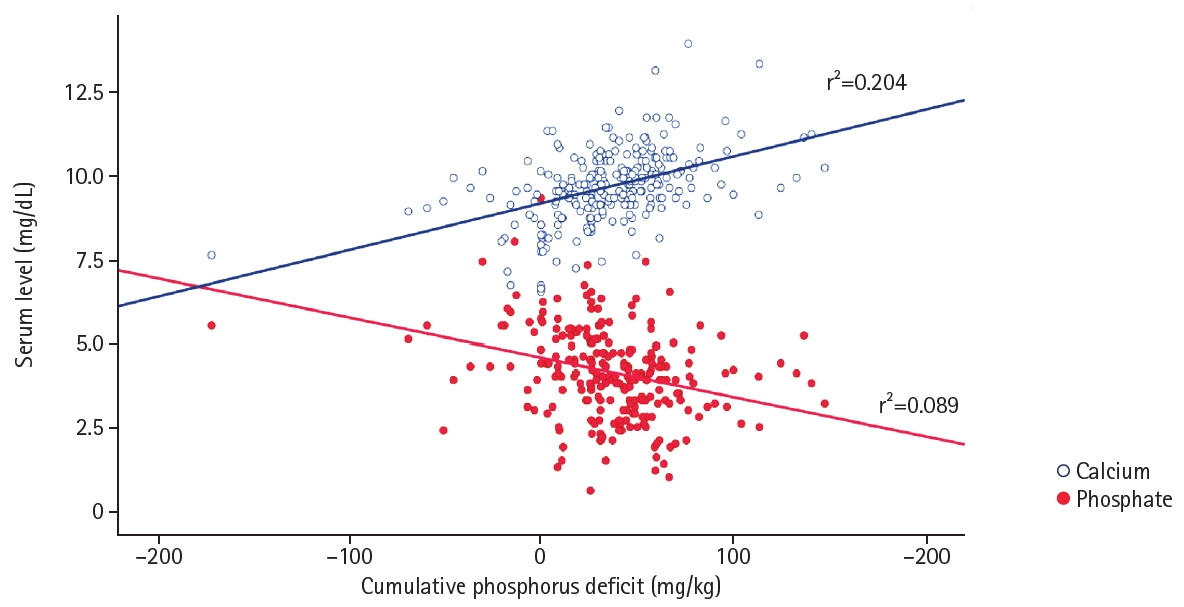
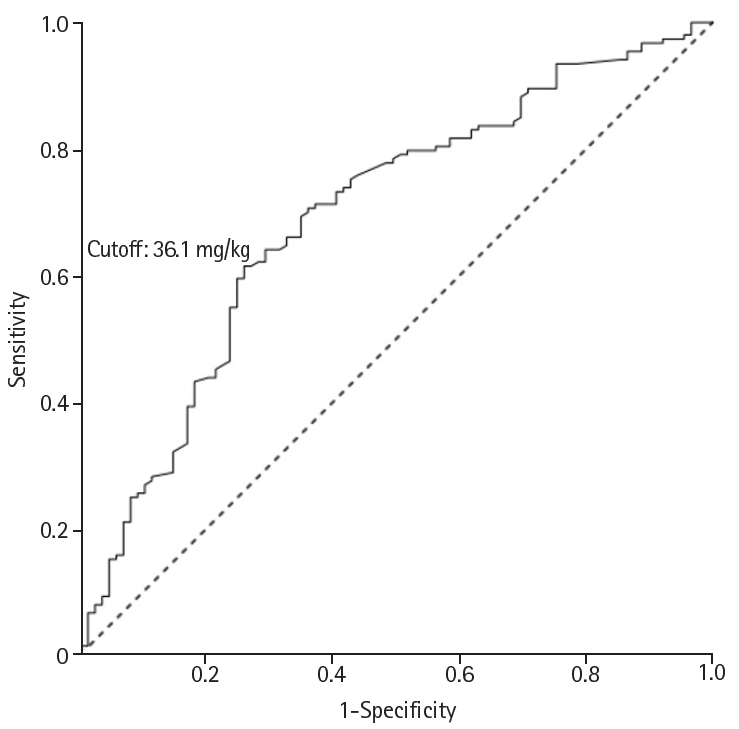
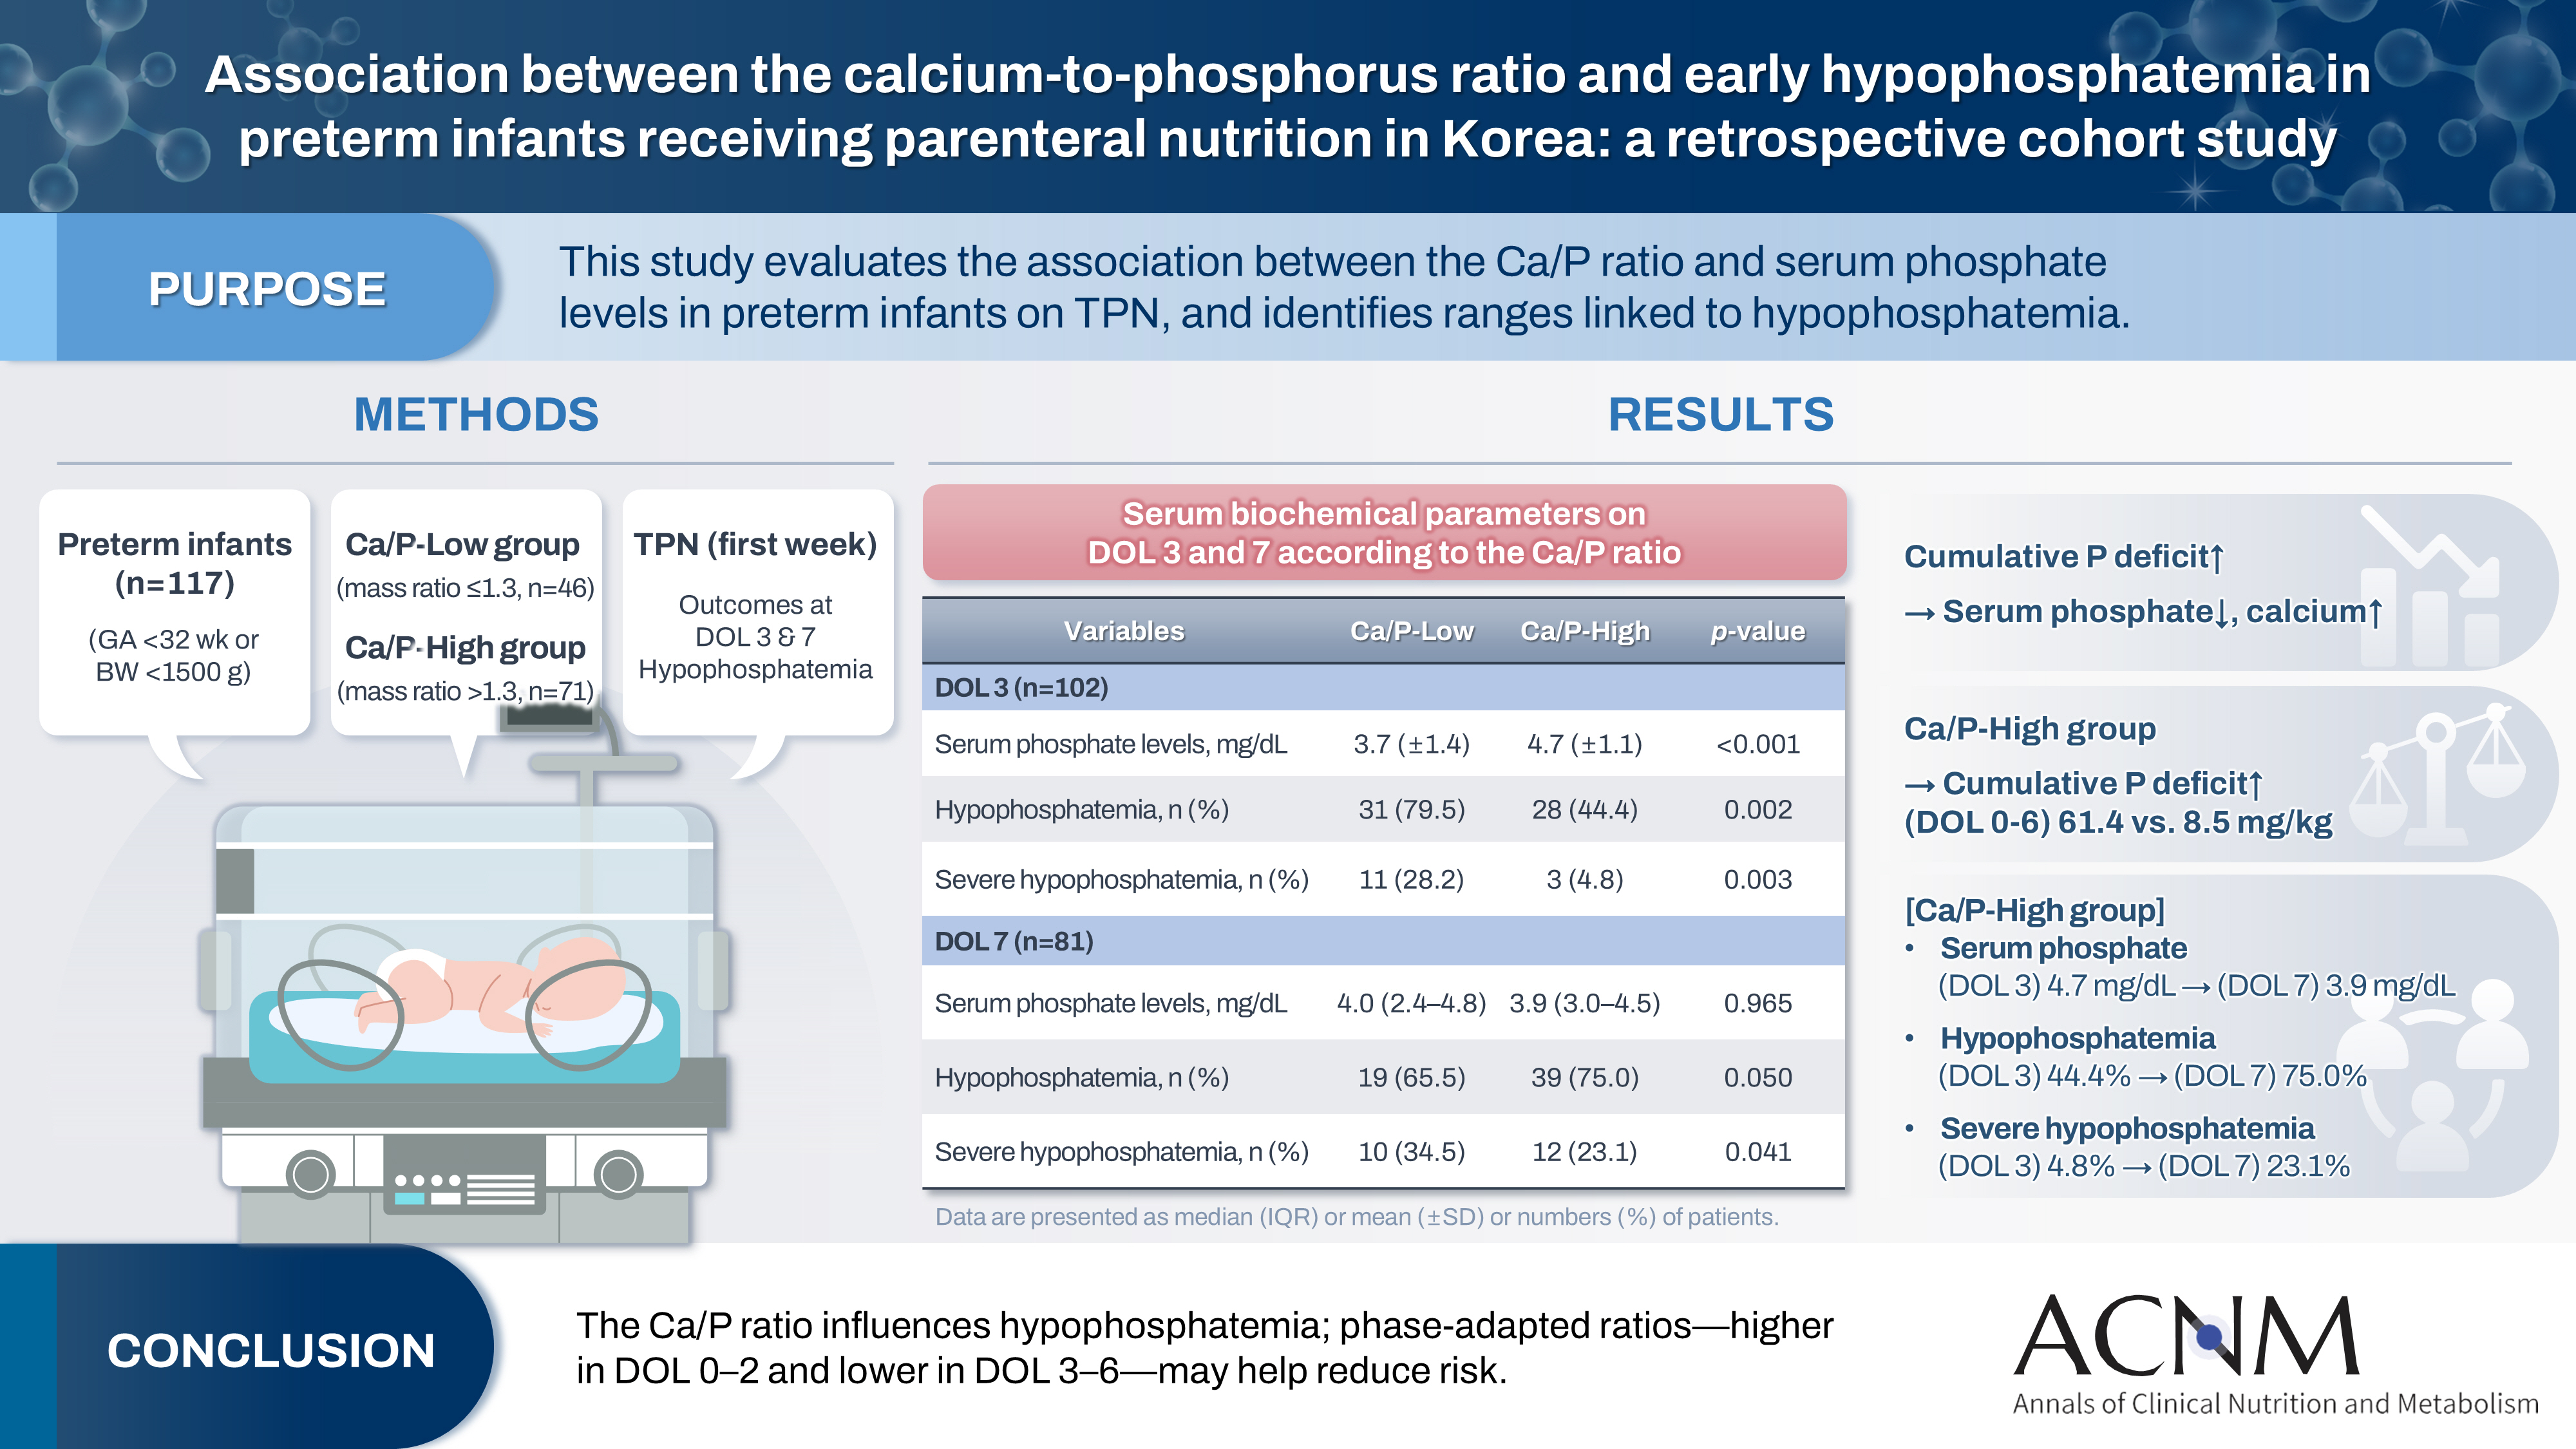
Fig. 1. Relationship between cumulative phosphorus deficit and serum calcium and phosphate levels. Serum calcium levels showed a positive correlation (r2=0.204), whereas serum phosphate levels showed a negative correlation (r2=0.089) with cumulative phosphorus deficit. Linear regression analysis was performed.
Fig. 2. Receiver operating characteristic (ROC) curve of cumulative phosphorus deficit for predicting hypophosphatemia during the first week of life. The optimal cutoff value was 36.1 mg/kg (sensitivity, 61.4%; specificity, 74.2%; accuracy, 66.1%). The area under the ROC curve was 0.694 (95% confidence interval [CI], 0.625–0.763; P<0.001). A P-value <0.05 was considered significant.
Graphical abstract
Fig. 1.
Fig. 2.
Graphical abstract
Association between the calcium-to-phosphorus ratio and early hypophosphatemia in preterm infants receiving parenteral nutrition in Korea: a retrospective cohort study
| Variable | Ca/P-Low (n=46) | Ca/P-High (n=71) | P-value |
|---|---|---|---|
| Demographic characteristics | |||
| Gestational age (wk) | 28.5 (26.0–30.0) | 28.0 (27.0–29.0) | 0.966 |
| Birth weight (g) | 1,045 (820–1,380) | 1,130 (1,003–1,385) | 0.063 |
| Male sex | 32 (69.6) | 40 (56.3) | 0.151 |
| SGA | 7 (15.2) | 4 (5.6) | 0.026 |
| Cesarean section | 38 (82.6) | 47 (66.2) | 0.052 |
| PROM | 11 (23.9) | 27 (38.0) | 0.111 |
| Antenatal steroids | 28 (60.9) | 52 (73.2) | 0.160 |
| Preeclampsia/eclampsia | 14 (30.4) | 14 (19.7) | 0.185 |
| Apgar score, 1 min | 5 (3–6) | 5 (4–6) | 0.305 |
| Apgar score, 5 min | 7 (6–7) | 7 (6–8) | 0.450 |
| Neonatal outcomes | |||
| Duration of TPN (day) | 17.5 (8.0–32.0) | 11.0 (7.0–21.0) | 0.065 |
| Days needed to regain birth weight (day) | 10.2±4.7 | 10.9±4.2 | 0.373 |
| Mortality | 5 (10.9) | 3 (4.2) | 0.260 |
| Culture-proven sepsis | 10 (21.7) | 4 (5.6) | 0.009 |
| Moderate-to-severe BPD | 10 (23.8) | 20 (29.0) | 0.311 |
| IVH G3 and higher | 3 (6.5) | 5 (7.0) | >0.999 |
| ROP with laser or anti-VEGF therapy | 4 (9.8) | 3 (4.3) | 0.129 |
| NEC G2 or higher | 3 (6.5) | 1 (1.4) | 0.298 |
| Rickets | 16 (40.0) | 30 (43.5) | 0.107 |
| Nephrocalcinosis | 4 (9.1) | 8 (11.6) | 0.763 |
| Variable | Ca/P-Low | Ca/P-High | P-value |
|---|---|---|---|
| Parenteral nutrition (DOL 0–2) | |||
| Fluid (mL/kg/day) | 70.0 (60.0 to 80.0) | 70.0 (60.0 to 80.0) | 0.847 |
| Energy (kcal/kg/day) | 53.7±9.4 | 51.3±10.7 | 0.053 |
| Amino acids (g/kg/day) | 2.0 (2.0 to 2.5) | 2.0 (2.0 to 2.5) | 0.126 |
| Glucose (g/kg/day) | 7.9 (7.2 to 8.6) | 7.9 (7.2 to 8.6) | 0.209 |
| Lipid (g/kg/day) | 1.5 (1.0 to 1.5) | 1.0 (1.0 to 1.5) | 0.455 |
| Calcium (mg/kg/day) | 30.0 (18.0 to 36.0) | 36.0 (24.0 to 42.0) | 0.019 |
| Phosphate (mg/kg/day) | 0 (0 to 15.5) | 0 (0 to 0) | 0.010 |
| Parenteral nutrition (DOL 3–6) | |||
| Fluid (mL/kg/day) | 85.0 (65.0 to 95.4) | 83.0 (70.0 to 97.5) | 0.780 |
| Energy (kcal/kg/day) | 72.6±14.1 | 73.5±16.4 | 0.576 |
| Amino acids (g/kg/day) | 2.8 (2.5 to 3.0) | 3.0 (2.5 to 3.0) | 0.866 |
| Glucose (g/kg/day) | 10.1 (8.6 to 10.8) | 10.1 (8.6 to 11.5) | 0.494 |
| Lipid (g/kg/day) | 2.5 (2.0 to 2.5) | 2.5 (2.0 to 3.0) | 0.263 |
| Calcium (mg/kg/day) | 6.0 (0 to 18.0) | 15.6 (6.0 to 24.0) | <0.001 |
| Phosphate (mg/kg/day) | 24.8 (15.5 to 31.0) | 15.5 (12.4 to 15.5) | <0.001 |
| Enteral nutrition (DOL 0–2) | |||
| Fluid (mL/kg/day) | 3.4 (0 to 9.3) | 6.6 (0 to 14.5) | 0.002 |
| Energy (kcal/kg/day) | 2.4 (0 to 6.5) | 4.7 (0 to 9.9) | 0.002 |
| Amino acids (g/kg/day) | 0.1 (0 to 0.2) | 0.1 (0 to 0.3) | 0.005 |
| Calcium (mg/kg/day) | 3.6 (0 to 10.1) | 7.2 (0 to 15.4) | 0.002 |
| Phosphate (mg/kg/day) | 1.9 (0 to 5.2) | 3.7 (0 to 7.9) | 0.002 |
| Enteral nutrition (DOL 3–6) | |||
| Fluid (mL/kg/day) | 8.3 (0 to 31.2) | 12.9 (0 to 30.4) | 0.490 |
| Energy (kcal/kg/day) | 5.8 (0 to 21.6) | 9.0 (0 to 21.3) | 0.492 |
| Amino acids (g/kg/day) | 0.2 (0 to 0.6) | 0.3 (0 to 0.6) | 0.495 |
| Calcium (mg/kg/day) | 8.8 (0 to 31.9) | 12.6 (0 to 31.2) | 0.514 |
| Phosphate (mg/kg/day) | 4.5 (0 to 16.4) | 6.5 (0 to 16.1) | 0.500 |
| Total intake (PN+EN, DOL 0–2) | |||
| Calcium (mg/kg/day) | 36.2 (23.2 to 43.2) | 42.0 (34.6 to 49.0) | <0.001 |
| Phosphate (mg/kg/day) | 5.2 (0.0 to 18.7) | 5.3 (0.3 to 15.5) | 0.705 |
| Total intake (PN+EN, DOL 3–6) | |||
| Calcium (mg/kg/day) | 24.4 (6.0 to 45.2) | 33.0 (18.0 to 48.4) | 0.004 |
| Phosphate (mg/kg/day) | 31.2 (20.1 to 46.5) | 24.0 (15.5 to 34.4) | <0.001 |
| Theoretical calculations for phosphorus intake (PN, DOL 0–2) | |||
| Estimated phosphorus need (mg/kg/day) | 22.3 (18.1 to 25.8) | 23.6 (18.7 to 26.4) | 0.126 |
| Deficit of phosphorus intake (mg/kg/day) | 18.1 (4.4 to 23.6) | 20.8 (8.2 to 26.4) | 0.011 |
| Theoretical calculations for phosphorus intake (PN, DOL 3–6) | |||
| Estimated phosphorus need (mg/kg/day) | 18.8 (13.4 to 22.8) | 21.6 (16.7 to 25.8) | <0.001 |
| Deficit of phosphorus intake (mg/kg/day) | –3.7 (–15.5 to 3.9) | 6.20 (–0.3 to 12.4) | <0.001 |
| Theoretical calculations for phosphorus intake (PN, DOL 0–6) | |||
| Estimated phosphorus need (mg/kg/day) | 20.2 (15.3 to 25.1) | 23.0 (17.4 to 26.4) | <0.001 |
| Deficit of phosphorus intake (mg/kg/day) | 2.1 (–9.3 to 11.1) | 9.6 (2.6 to 19.5) | <0.001 |
| Cumulative phosphorus deficit (mg/kg) | 8.5±41.6 | 61.4±33.7 | <0.001 |
| Variable | Ca/P-Low | Ca/P-High | P-value |
|---|---|---|---|
| DOL 3 (n=102) | |||
| Serum phosphate levels (mg/dL) | 3.7±1.4 | 4.7±1.1 | <0.001 |
| Serum calcium levels (mg/dL) | 9.7±0.9 | 9.5±1.0 | 0.233 |
| Serum albumin (g/dL) | 3.2±0.3 | 3.3±0.4 | 0.169 |
| Hypophosphatemiaa | 31 (79.5) | 28 (44.4) | 0.002 |
| Severe hypophosphatemiab | 11 (28.2) | 3 (4.8) | 0.003 |
| DOL 7 (n=81) | |||
| Serum phosphate levels (mg/dL) | 4.0 (2.4–4.8) | 3.9 (3.0–4.5) | 0.965 |
| Serum calcium levels (mg/dL) | 9.9±1.0 | 10.2±1.1 | 0.308 |
| Serum albumin (g/dL) | 3.1±0.5 | 3.3±0.6 | 0.127 |
| Hypophosphatemiaa | 19 (65.5) | 39 (75.0) | 0.050 |
| Severe hypophosphatemiab | 10 (34.5) | 12 (23.1) | 0.041 |
| Variable | Adjusted OR (95% CI) | P-value |
|---|---|---|
| Gestational age | 1.31 (0.89–1.94) | 0.175 |
| Birth weight | 1.00 (0.99–1.00) | 0.024 |
| SGA | 2.31 (0.18–29.51) | 0.520 |
| P (PN+EN, DOL 0–2) | 0.98 (0.95–1.00) | 0.089 |
| Ca (PN+EN, DOL 0–2) | 1.02 (1.00–1.04) | 0.016 |
| Morbidities | OR (95% CI) | P-value |
|---|---|---|
| Mortality | 2.63 (0.62–11.21) | 0.190 |
| Culture-proven sepsis | 3.95 (1.25–12.45) | 0.019 |
| Moderate-to-severe BPD | 1.43 (0.58–3.54) | 0.441 |
| IVH G3 or higher | 4.60 (1.03–20.46) | 0.045 |
| ROP with laser or anti-VEGF therapy | 3.75 (0.79–17.86) | 0.097 |
| NEC G2 or higher | 7.94 (0.80–79.20) | 0.078 |
| Rickets | 2.99 (1.27–7.07) | 0.013 |
| Nephrocalcinosis | 2.61 (0.78–8.77) | 0.121 |
Table 1. Demographic characteristics and neonatal outcomes
Values are presented as median (interquartile range ), number (%), or mean±SD. Ca/P, calcium-to-phosphorus; SGA, small for gestational age; PROM, premature rupture of membranes; TPN, total parenteral nutrition; BPD, bronchopulmonary dysplasia; IVH, intraventricular hemorrhage; ROP, retinopathy of prematurity; VEGF, vascular endothelial growth factor; NEC, necrotizing enterocolitis; SD, standard deviation. A P-value <0.05 was considered significant.
Table 2. Comparison of nutritional composition according to the Ca/P ratio
Values are presented as median (interquartile range) or mean±SD. Ca/P, calcium-to-phosphorus; DOL, day of life; PN, parenteral nutrition; EN, enteral nutrition; SD, standard deviation. A P-value <0.05 was considered significant.
Table 3. Serum biochemical parameters on DOL 3 and 7 according to the Ca/P ratio
Values are presented as mean±SD, number (%), or median (interquartile range). DOL, day of life; Ca/P, calcium-to-phosphorus; SD, standard deviation. aHypophosphatemia: serum phosphate level <4.5 mg/dL. bSevere hypophosphatemia: serum phosphate level <3.0 mg/dL. A P-value <0.05 was considered significant.
Table 4. Multivariable logistic regression for early hypophosphatemia on DOL 3
DOL, day of life; OR, odds ratio; CI, confidence interval; SGA, small for gestational age; P, phosphorus; PN, parenteral nutrition; EN, enteral nutrition; Ca, calcium. The model was adjusted for gestational age, birth weight, SGA, total phosphorus and calcium intakes during DOL 0–2. Ca and phosphorus P intakes are expressed as mg/kg/day.
Table 5. Logistic regression analysis of the association between severe hypophosphatemia and neonatal morbidities
OR, odds ratio; CI, confidence interval; BPD, bronchopulmonary dysplasia; IVH, intraventricular hemorrhage; ROP, retinopathy of prematurity; VEGF, vascular endothelial growth factor; NEC, necrotizing enterocolitis; Ca/P, calcium-to-phosphorus. The Ca/P-Low group was used as the reference category. Estimates may be unstable due to limited events. A P-value <0.05 was considered significant.

