Scopus, KCI, KoreaMed

Articles
- Page Path
- HOME > Ann Clin Nutr Metab > Volume 15(3); 2023 > Article
- Original Article Multi-biomarker approach to metabolic syndrome and associated diseases in Turkey: a cross sectional study
-
Semra Can Mamur1
 , Omer Colak2
 , Selma Metintas3
 , Inci Arikan4
 , Mehmet Kara5
-
Annals of Clinical Nutrition and Metabolism 2023;15(3):88-96.
DOI: https://doi.org/10.15747/ACNM.2023.15.3.88
Published online: December 1, 2023
1Department of Biochemistry, Yunus Emre State Hospital, Eskisehir, Turkey
2Simge Medical Laboratory, Eskisehir, Turkey
3Department of Public Health, Medical Faculty, Eskisehir Osmangazi University, Eskisehir, Turkey
4Department of Public Health, Medical Faculty, Kutahya Health Sciences University, Kutahya, Turkey
5Department of Biochemistry, Medical Faculty, Karabuk University, Karabuk, Turkey
- Corresponding author: Semra Can Mamur, email: drsemracan@gmail.com.tr
© 2023 The Korean Society of Surgical Metabolism and Nutrition · The Korean Society for Parenteral and Enteral Nutrition
This is an open-access article distributed under the terms of the Creative Commons Attribution Non-Commercial License (http://creativecommons.org/licenses/by-nc/4.0), which permits unrestricted non-commercial use, distribution, and reproduction in any medium, provided the original work is properly cited.
- 2,082 Views
- 13 Download
Abstract
-
Purpose Biomarker for cardiovascular diseases (CVDs) are important in the clinical monitoring of individuals with metabolic syndrome (MetS). The use of these biomarkers in combination may be predictive of CVDs. This study aimed to demonstrate the ability of multiple biomarkers to predict MetS, diabetes mellitus (DM), and CVDs. The use of multiple biomarkers instead of a single biomarker may be more useful in early diagnosis. We investigated the use of a multi-biomarker approach in MetS and associated diseases.
-
Methods The study was performed by selecting control (n=30), MetS (n=30), MetS+DM (n=30), and MetS+CVD (n=30) groups from data of the Eskisehir Healthy Hearts Project conducted from January 2008 to October 2009 in Turkey. We recorded serum level of biomarkers, including lipid profile, liver enzyme, paraoxonase, arylesterase and arginase to find their difference among the groups.
-
Results Compared to the control group, gamma-glutamyl transferase (GGT) and arginase levels increased, while paraoxonase and arylesterase activity and high-density lipoprotein–cholesterol levels were low in the patient groups (P<0.001). A negative correlation was observed between paraoxonase and arylesterase activity and MetS.
-
Conclusion We believe that the combined use of biomarkers, including GGT, arginase, paraoxonase, and arylesterase, may be useful in predicting diseases such as MetS and CVDs.
Introduction
Methods
Results
Discussion
Supplementary materials
Acknowledgments
Authors’ contribution
Conceptualization: SCM. Data curation: SCM, OC, SM. Formal analysis: SCM, SM. Funding acquisition: OC. Investigation: SCM, IA, MK. Methodology: SCM, SM. Supervision: OC, SM. Validation: OC, SM. Visualization: SCM. Writing – original draft: SCM. Writing – review and editing: all authors.
Conflict of interest
The authors of this manuscript have no conflicts of interest to disclose.
Funding
This research was produced from the medical specialty thesis of Semra Can Mamur on ‘Multi-biomarker approach to metabolic syndrome and associated diseases’.
Data availability
Contact the corresponding author for data availability.
| Control (n=30) | MetS (n=30) | MetS+DM (n=30) | MetS+CVD (n=30) | Statistical comparison | |
|---|---|---|---|---|---|
| Age (yr) | 45±7 | 52±9 | 55±6 | 53±8 | P<0.001 |
| Gender | X2=11.648; P=0.009 | ||||
| Man | 19 (63.3) | 17 (56.7) | 12 (40.0) | 7 (23.3) | |
| Woman | 11 (36.7) | 13 (43.3) | 18 (60.0) | 23 (76.7) | |
| Waist (cm) | 78±8 | 104±7 | 97±9 | 98±10 | P<0.001 |
| Hip (cm) | 95±6 | 110±20 | 114±12 | 115±9 | P<0.001 |
| SBP (mmHg) | 108±20 | 151±19 | 156±25 | 158±24 | P<0.001a |
| DBP (mmHg) | 70±8 | 93±19 | 93±14 | 97±12 | P<0.001 |
| TC (mg/dL) | 152±22 | 205±38 | 224±50 | 214±51 | P<0.001 |
| LDL (mg/dL) | 91±18 | 128±33 | 153±41 | 143±46 | P<0.001 |
| HDL (mg/dL) | 48±5 | 34±4 | 38±4 | 37±3 | P<0.001 |
| TG (mg/dL) | 94±23 | 225±75 | 211±76 | 257±125 | P<0.001 |
| Glucose (mg/dL) | 81±7 | 97±26 | 173±59 | 102±26 | P<0.001a |
| AST (U/L) | 21±5 | 23±9 | 27±15 | 27±17 | P=0.781a |
| ALT (U/L) | 20±18 | 24±16 | 24±17 | 33±40 | P=0.399a |
| GGT (U/L) | 14±7 | 32±36 | 40±32 | 60±83 | P<0.001a |
| PON-1 (U/L) | 251±65 | 224±221 | 122±58 | 113±51 | P<0.001a |
| ARE (U/L) | 333±64 | 305±50 | 285±52 | 277±54 | P<0.001a |
| ARG (U/L) | 2.03±1.39 | 4.72±2.74 | 5.16±2.96 | 4.66±2.74 | P<0.001a |
Values are presented as mean±standard deviation or number (%).
MetS = metabolic syndrome; DM = diabetes mellitus; CVD = cardiovascular disease; SBP = systolic blood pressure; DBP = diastolic blood pressure; TC = total cholesterol; LDL = low-density lipoprotein; HDL = high-density lipoprotein; TG = triglyceride; AST = aspartate aminotransferase; ALT = alanine aminotransferase; GGT = gamma-glutamyl transferase; PON-1 = paraoxonase; ARE = arylesterase; ARG = arginase.
aKruskal–Wallis test.
| Waist circumference |
Increased TG level |
Low HDL level |
FBG |
Blood pressure |
No. of MetS components | MetS | |
|---|---|---|---|---|---|---|---|
| Log PON-1 | −0.27** | −0.38** | −0.25* | −0.17 | −0.29* | −0.39** | −0.40** |
| Log ARE | −0.05 | −0.13 | −0.11 | −0.17 | −0.10 | −0.05 | −0.26* |
| Log ARG | 0.16 | 0.27* | 0.19* | 0.12 | 0.23* | 0.17 | 0.30** |
| Log GGT | 0.26* | 0.43** | 0.22* | 0.19* | 0.38** | 0.37** | 0.38** |
| Variable |
Unadjusted OR (95% CI) |
Adjusted OR (95% CI)a |
|---|---|---|
| Age | 1.19 (1.12–1.28) | |
| Gender | 2.59 (1.10–6.09) | |
| Waist | 1.26 (1.16–1.37) | 1.24 (1.13–1.35) |
| Hip | 1.16 (1.09–1.22) | 1.10 (1.03–1.18) |
| BMI | 2.00 (1.53–2.62) | 1.96 (1.42–2.71) |
| SBP | 1.51 (1.19–1.91) | 1.56 (1.34–2.14) |
| DBP | 1.16 (1.00–1.23) | 1.14 (1.07–1.23) |
| TC | 1.06 (1.04–1.09) | 1.05 (1.02–1.07) |
| LDL | 1.07 (1.04–1.11) | 1.06 (1.02–1.09) |
| HDL | 0.64 (0.54–0.75) | 0.56 (0.42–0.76) |
| TG | 1.06 (1.04–1.09) | 1.10 (1.03–1.17) |
| Glucose | 1.10 (1.05–1.15) | 1.09 (1.03–1.15) |
| AST | 1.04 (0.99–1.09) | 1.07 (0.99–1.14) |
| ALT | 1.02 (0.99–1.05) | 1.03 (0.99–1.06) |
| GGT | 1.13 (1.06–1.20) | 1.16 (1.07–1.26) |
| PON-1 | 0.99 (0.99–0.99) | 0.99 (0.98–0.99) |
| ARE | 0.99 (0.98–0.99) | 0.98 (0.97–0.99) |
| ARG | 1.85 (1.38–2.48) | 1.64 (1.17–2.29) |
OR = odds ratio; 95% CI = 95% confidence interval; BMI = body mass index; SBP = systolic blood pressure; DBP = diastolic blood pressure; TC = total cholesterol; LDL = low-density lipoprotein; HDL = high-density lipoprotein; TG = triglyceride; AST = aspartate aminotransferase; ALT = alanine aminotransferase; GGT = gamma-glutamyl transferase; PON-1 = paraoxonase; ARE = arylesterase; ARG = arginase.
aAge- and gender-adjusted OR and 95% CI values.
- 1. Daskalopoulou SS, Mikhailidis DP, Elisaf M. Prevention and treatment of the metabolic syndrome. Angiology 2004;55:589-612. ArticlePubMedPDF
- 2. Durrington PN, Mackness B, Mackness MI. Paraoxonase and atherosclerosis. Arterioscler Thromb Vasc Biol 2001;21:473-80. ArticlePubMed
- 3. Jayakumari N, Thejaseebai G. High prevalence of low serum paraoxonase-1 in subjects with coronary artery disease. J Clin Biochem Nutr 2009;45:278-84. ArticlePubMedPMC
- 4. Kaminskiĭ IG, Suslikov AV, Tikhonova LA, Galimova MK, Ermakov GL, Tsvetkov VD, et al. [Arginase, nitrates, and nitrites in the blood plasma and erythrocytes in hypertension and after therapy with lisinopril and simvastatin]. Izv Akad Nauk Ser Biol 2011;5:524-31; Russian.
- 5. Shemyakin A, Kövamees O, Rafnsson A, Böhm F, Svenarud P, Settergren M, et al. Arginase inhibition improves endothelial function in patients with coronary artery disease and type 2 diabetes mellitus. Circulation 2012;126:2943-50. ArticlePubMed
- 6. Leiva A, de Medina CD, Salsoso R, Sáez T, San Martín S, Abarzúa F, et al. Maternal hypercholesterolemia in pregnancy associates with umbilical vein endothelial dysfunction: role of endothelial nitric oxide synthase and arginase II. Arterioscler Thromb Vasc Biol 2013;33:2444-53. PubMed
- 7. Ryoo S, Gupta G, Benjo A, Lim HK, Camara A, Sikka G, et al. Endothelial arginase II: a novel target for the treatment of atherosclerosis. Circ Res 2008;102:923-32. PubMed
- 8. Berkowitz DE, White R, Li D, Minhas KM, Cernetich A, Kim S, et al. Arginase reciprocally regulates nitric oxide synthase activity and contributes to endothelial dysfunction in aging blood vessels. Circulation 2003;108:2000-6. ArticlePubMed
- 9. Lee MY, Koh SB, Koh JH, Nam SM, Shin JY, Shin YG, et al. Relationship between gamma-glutamyltransferase and metabolic syndrome in a Korean population. Diabet Med 2008;25:469-75. PubMed
- 10. Thande N, Rosenson RS. Vascular biomarkers in the metabolic syndrome. Expert Rev Mol Diagn 2009;9:209-15. ArticlePubMed
- 11. Arıkan I, Metintaş S, Kalyoncu C. Application of healthy heart program in the two semi-rural areas in Eskişehir. Anadolu Kardiyol Derg 2011;11:485-91. PubMed
- 12. Expert Panel on Detection, Evaluation, and Treatment of High Blood Cholesterol in Adults. Executive summary of the third report of the National Cholesterol Education Program (NCEP) Expert Panel on Detection, Evaluation, and Treatment of High Blood Cholesterol in Adults (Adult Treatment Panel III). JAMA 2001;285:2486-97. ArticlePubMed
- 13. Geyer JW, Dabich D. Rapid method for determination of arginase activity in tissue homogenates. Anal Biochem 1971;39:412-7. ArticlePubMed
- 14. Garin MC, Kalix B, Morabia A, James RW. Small, dense lipoprotein particles and reduced paraoxonase-1 in patients with the metabolic syndrome. J Clin Endocrinol Metab 2005;90:2264-9. ArticlePubMedPDF
- 15. Andreeva-Gateva P, Popova D, Orbetsova V. [Antioxidant parameters in metabolic syndrome -- a dynamic evaluation during oral glucose tolerance test]. Vutr Boles 2001;33:48-53; Bulgarian. PubMed
- 16. Kowalska K, Socha E, Milnerowicz H. Review: The role of paraoxonase in cardiovascular diseases. Ann Clin Lab Sci 2015;45:226-33. PubMed
- 17. Ross R. Atherosclerosis--an inflammatory disease. N Engl J Med 1999;340:115-26. ArticlePubMed
- 18. Ansell BJ, Navab M, Hama S, Kamranpour N, Fonarow G, Hough G, et al. Inflammatory/antiinflammatory properties of high-density lipoprotein distinguish patients from control subjects better than high-density lipoprotein cholesterol levels and are favorably affected by simvastatin treatment. Circulation 2003;108:2751-6. ArticlePubMed
- 19. Mackness B, Davies GK, Turkie W, Lee E, Roberts DH, Hill E, et al. Paraoxonase status in coronary heart disease: are activity and concentration more important than genotype? Arterioscler Thromb Vasc Biol 2001;21:1451-7. PubMed
- 20. Granér M, James RW, Kahri J, Nieminen MS, Syvänne M, Taskinen MR. Association of paraoxonase-1 activity and concentration with angiographic severity and extent of coronary artery disease. J Am Coll Cardiol 2006;47:2429-35. ArticlePubMed
- 21. Gur M, Aslan M, Yildiz A, Demirbag R, Yilmaz R, Selek S, et al. Paraoxonase and arylesterase activities in coronary artery disease. Eur J Clin Invest 2006;36:779-87. ArticlePubMed
- 22. Ikeda Y, Suehiro T, Arii K, Kumon Y, Hashimoto K. High glucose induces transactivation of the human paraoxonase 1 gene in hepatocytes. Metabolism 2008;57:1725-32. ArticlePubMed
- 23. Lu C, Gao Y, Zhou H, Tian H. The relationships between PON1 activity as well as oxLDL levels and coronary artery lesions in CHD patients with diabetes mellitus or impaired fasting glucose. Coron Artery Dis 2008;19:565-73. ArticlePubMed
- 24. Ryoo S, Lemmon CA, Soucy KG, Gupta G, White AR, Nyhan D, et al. Oxidized low-density lipoprotein-dependent endothelial arginase II activation contributes to impaired nitric oxide signaling. Circ Res 2006;99:951-60. ArticlePubMed
- 25. Kim OY, Lee SM, Chung JH, Do HJ, Moon J, Shin MJ. Arginase I and the very low-density lipoprotein receptor are associated with phenotypic biomarkers for obesity. Nutrition 2012;28:635-9. ArticlePubMed
- 26. Oda E, Kawai R, Watanabe K, Sukumaran V. Prevalence of metabolic syndrome increases with the increase in blood levels of gamma glutamyltransferase and alanine aminotransferase in Japanese men and women. Intern Med 2009;48:1343-50. ArticlePubMed
- 27. Ruttmann E, Brant LJ, Concin H, Diem G, Rapp K, Ulmer H. Vorarlberg Health Monitoring and Promotion Program Study Group. Gamma-glutamyltransferase as a risk factor for cardiovascular disease mortality: an epidemiological investigation in a cohort of 163,944 Austrian adults. Circulation 2005;112:2130-7. ArticlePubMed
- 28. Lee DS, Evans JC, Robins SJ, Wilson PW, Albano I, Fox CS, et al. Gamma glutamyl transferase and metabolic syndrome, cardiovascular disease, and mortality risk: the Framingham heart study. Arterioscler Thromb Vasc Biol 2007;27:127-33. PubMed
- 29. Devers MC, Campbell S, Shaw J, Zimmet P, Simmons D. Should liver function tests be included in definitions of metabolic syndrome? Evidence from the association between liver function tests, components of metabolic syndrome and prevalent cardiovascular disease. Diabet Med 2008;25:523-9. ArticlePubMed
References
Figure & Data
REFERENCES
Citations


Fig. 1
Fig. 2
Fig. 3
Fig. 4
Demographic and biochemical characteristics of the study groups
| Control (n=30) | MetS (n=30) | MetS+DM (n=30) | MetS+CVD (n=30) | Statistical comparison | |
|---|---|---|---|---|---|
| Age (yr) | 45±7 | 52±9 | 55±6 | 53±8 | P<0.001 |
| Gender | X2=11.648; P=0.009 | ||||
| Man | 19 (63.3) | 17 (56.7) | 12 (40.0) | 7 (23.3) | |
| Woman | 11 (36.7) | 13 (43.3) | 18 (60.0) | 23 (76.7) | |
| Waist (cm) | 78±8 | 104±7 | 97±9 | 98±10 | P<0.001 |
| Hip (cm) | 95±6 | 110±20 | 114±12 | 115±9 | P<0.001 |
| SBP (mmHg) | 108±20 | 151±19 | 156±25 | 158±24 | P<0.001 |
| DBP (mmHg) | 70±8 | 93±19 | 93±14 | 97±12 | P<0.001 |
| TC (mg/dL) | 152±22 | 205±38 | 224±50 | 214±51 | P<0.001 |
| LDL (mg/dL) | 91±18 | 128±33 | 153±41 | 143±46 | P<0.001 |
| HDL (mg/dL) | 48±5 | 34±4 | 38±4 | 37±3 | P<0.001 |
| TG (mg/dL) | 94±23 | 225±75 | 211±76 | 257±125 | P<0.001 |
| Glucose (mg/dL) | 81±7 | 97±26 | 173±59 | 102±26 | P<0.001 |
| AST (U/L) | 21±5 | 23±9 | 27±15 | 27±17 | P=0.781 |
| ALT (U/L) | 20±18 | 24±16 | 24±17 | 33±40 | P=0.399 |
| GGT (U/L) | 14±7 | 32±36 | 40±32 | 60±83 | P<0.001 |
| PON-1 (U/L) | 251±65 | 224±221 | 122±58 | 113±51 | P<0.001 |
| ARE (U/L) | 333±64 | 305±50 | 285±52 | 277±54 | P<0.001 |
| ARG (U/L) | 2.03±1.39 | 4.72±2.74 | 5.16±2.96 | 4.66±2.74 | P<0.001 |
Values are presented as mean±standard deviation or number (%).
MetS = metabolic syndrome; DM = diabetes mellitus; CVD = cardiovascular disease; SBP = systolic blood pressure; DBP = diastolic blood pressure; TC = total cholesterol; LDL = low-density lipoprotein; HDL = high-density lipoprotein; TG = triglyceride; AST = aspartate aminotransferase; ALT = alanine aminotransferase; GGT = gamma-glutamyl transferase; PON-1 = paraoxonase; ARE = arylesterase; ARG = arginase.
aKruskal–Wallis test.
The partial correlation (r) levels of the study group parameters per metabolic syndrome and diagnostic criteria
| Waist circumference | Increased TG level |
Low HDL level |
FBG | Blood pressure |
No. of MetS components | MetS | |
|---|---|---|---|---|---|---|---|
| Log PON-1 | −0.27 |
−0.38 |
−0.25 |
−0.17 | −0.29 |
−0.39 |
−0.40 |
| Log ARE | −0.05 | −0.13 | −0.11 | −0.17 | −0.10 | −0.05 | −0.26 |
| Log ARG | 0.16 | 0.27 |
0.19 |
0.12 | 0.23 |
0.17 | 0.30 |
| Log GGT | 0.26 |
0.43 |
0.22 |
0.19 |
0.38 |
0.37 |
0.38 |
TG = triglyceride; HDL = high-density lipoprotein; FBG = fasting blood glucose; MetS = metabolic syndrome; PON-1 = paraoxonase; ARE = arylesterase; ARG = arginase; GGT = gamma-glutamyl transferase.
*P<0.05, **P<0.001.
Unadjusted and adjusted odds ratios and 95% confidence interval values for metabolic syndrome and its associated variables
| Variable | Unadjusted OR (95% CI) |
Adjusted OR (95% CI) |
|---|---|---|
| Age | 1.19 (1.12–1.28) | |
| Gender | 2.59 (1.10–6.09) | |
| Waist | 1.26 (1.16–1.37) | 1.24 (1.13–1.35) |
| Hip | 1.16 (1.09–1.22) | 1.10 (1.03–1.18) |
| BMI | 2.00 (1.53–2.62) | 1.96 (1.42–2.71) |
| SBP | 1.51 (1.19–1.91) | 1.56 (1.34–2.14) |
| DBP | 1.16 (1.00–1.23) | 1.14 (1.07–1.23) |
| TC | 1.06 (1.04–1.09) | 1.05 (1.02–1.07) |
| LDL | 1.07 (1.04–1.11) | 1.06 (1.02–1.09) |
| HDL | 0.64 (0.54–0.75) | 0.56 (0.42–0.76) |
| TG | 1.06 (1.04–1.09) | 1.10 (1.03–1.17) |
| Glucose | 1.10 (1.05–1.15) | 1.09 (1.03–1.15) |
| AST | 1.04 (0.99–1.09) | 1.07 (0.99–1.14) |
| ALT | 1.02 (0.99–1.05) | 1.03 (0.99–1.06) |
| GGT | 1.13 (1.06–1.20) | 1.16 (1.07–1.26) |
| PON-1 | 0.99 (0.99–0.99) | 0.99 (0.98–0.99) |
| ARE | 0.99 (0.98–0.99) | 0.98 (0.97–0.99) |
| ARG | 1.85 (1.38–2.48) | 1.64 (1.17–2.29) |
OR = odds ratio; 95% CI = 95% confidence interval; BMI = body mass index; SBP = systolic blood pressure; DBP = diastolic blood pressure; TC = total cholesterol; LDL = low-density lipoprotein; HDL = high-density lipoprotein; TG = triglyceride; AST = aspartate aminotransferase; ALT = alanine aminotransferase; GGT = gamma-glutamyl transferase; PON-1 = paraoxonase; ARE = arylesterase; ARG = arginase.
aAge- and gender-adjusted OR and 95% CI values.
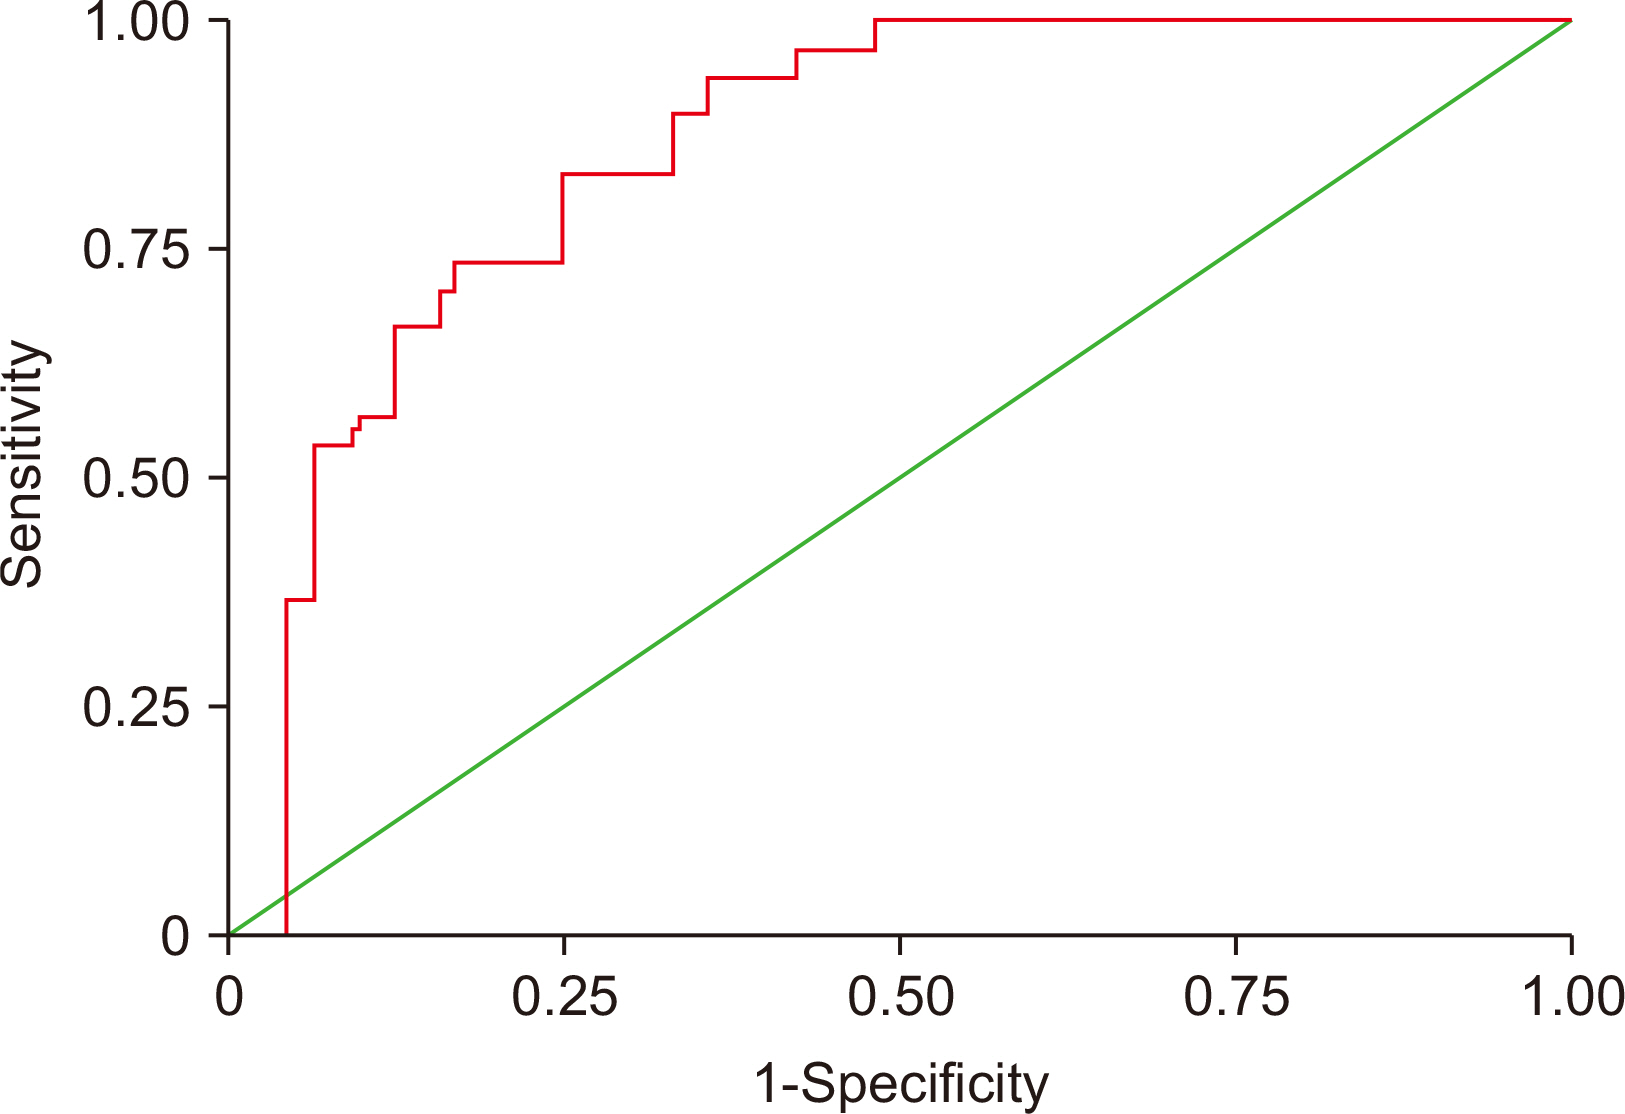
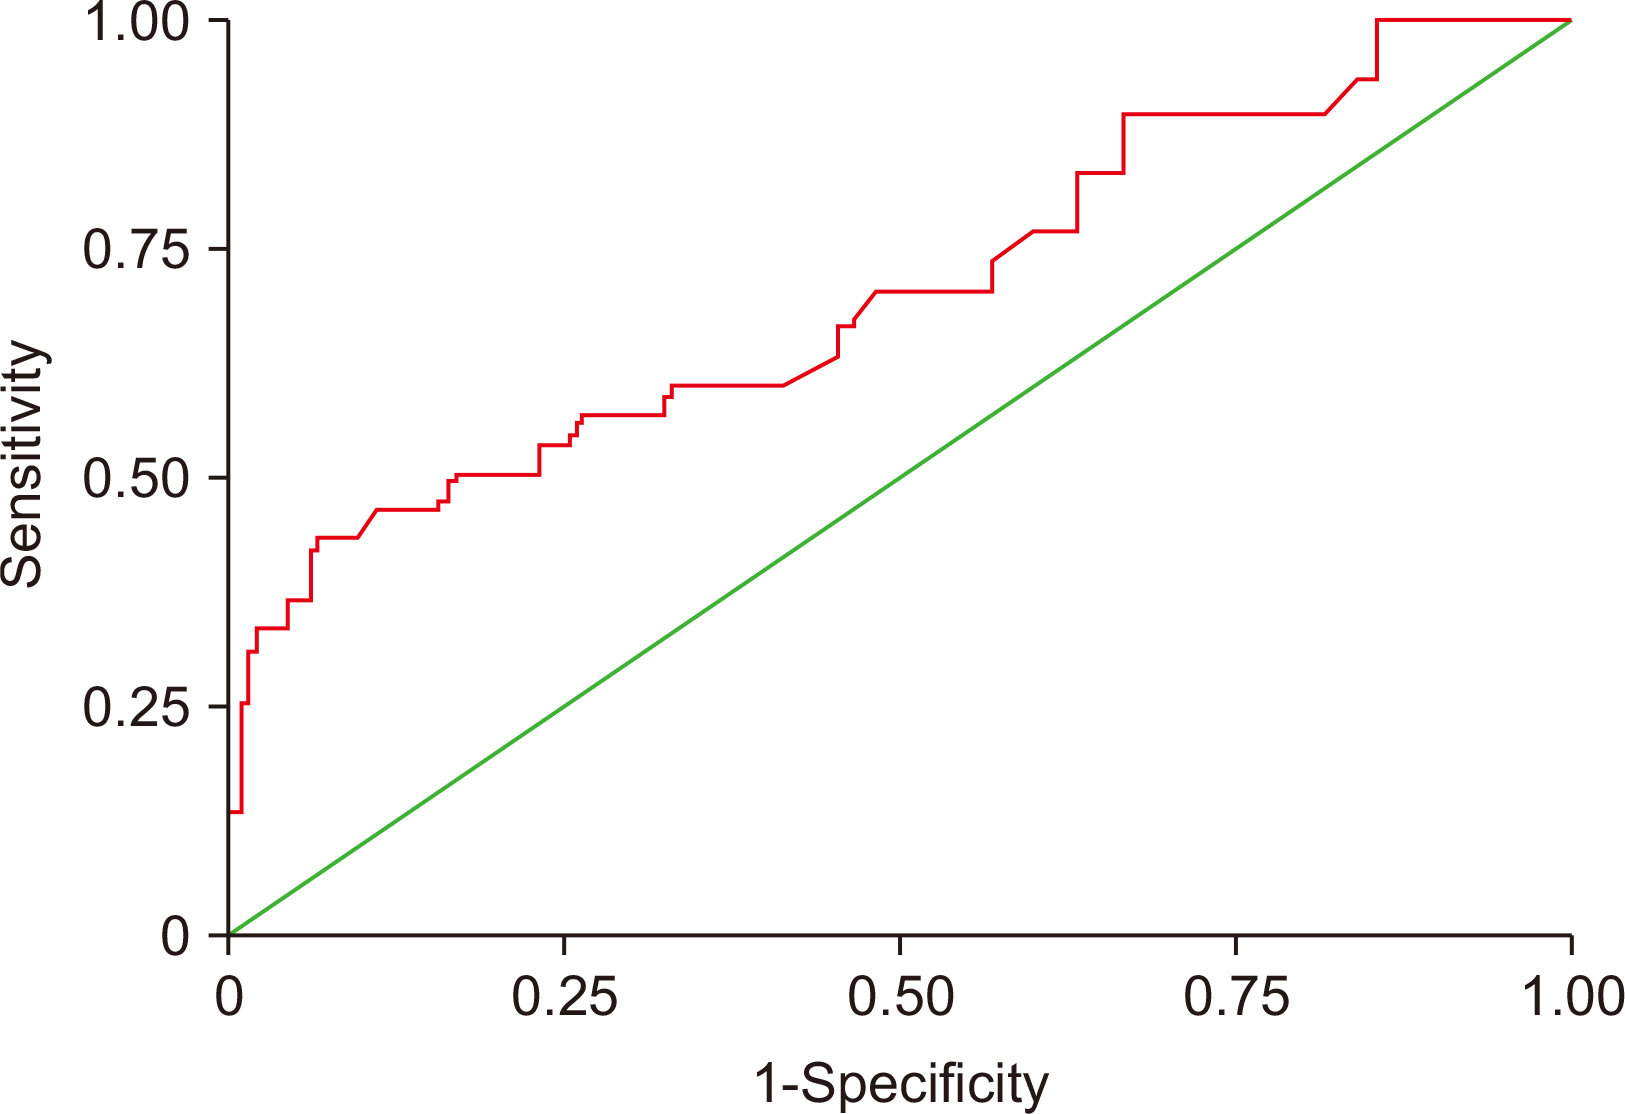
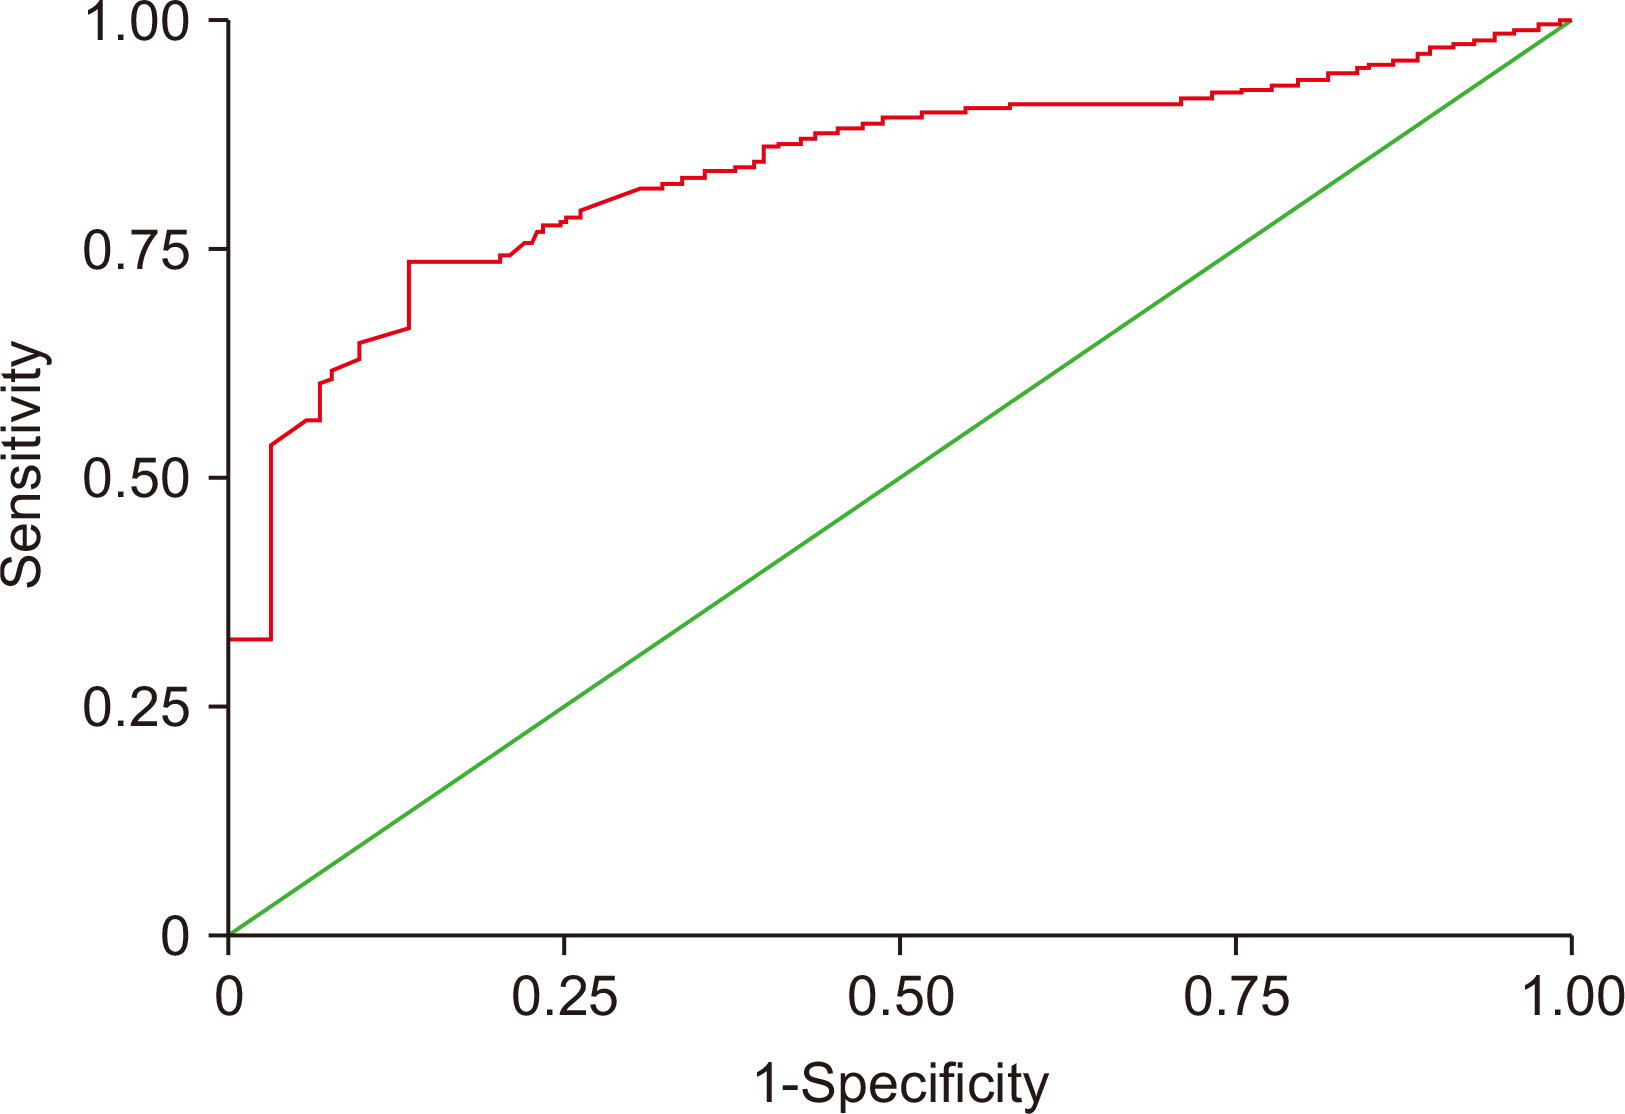
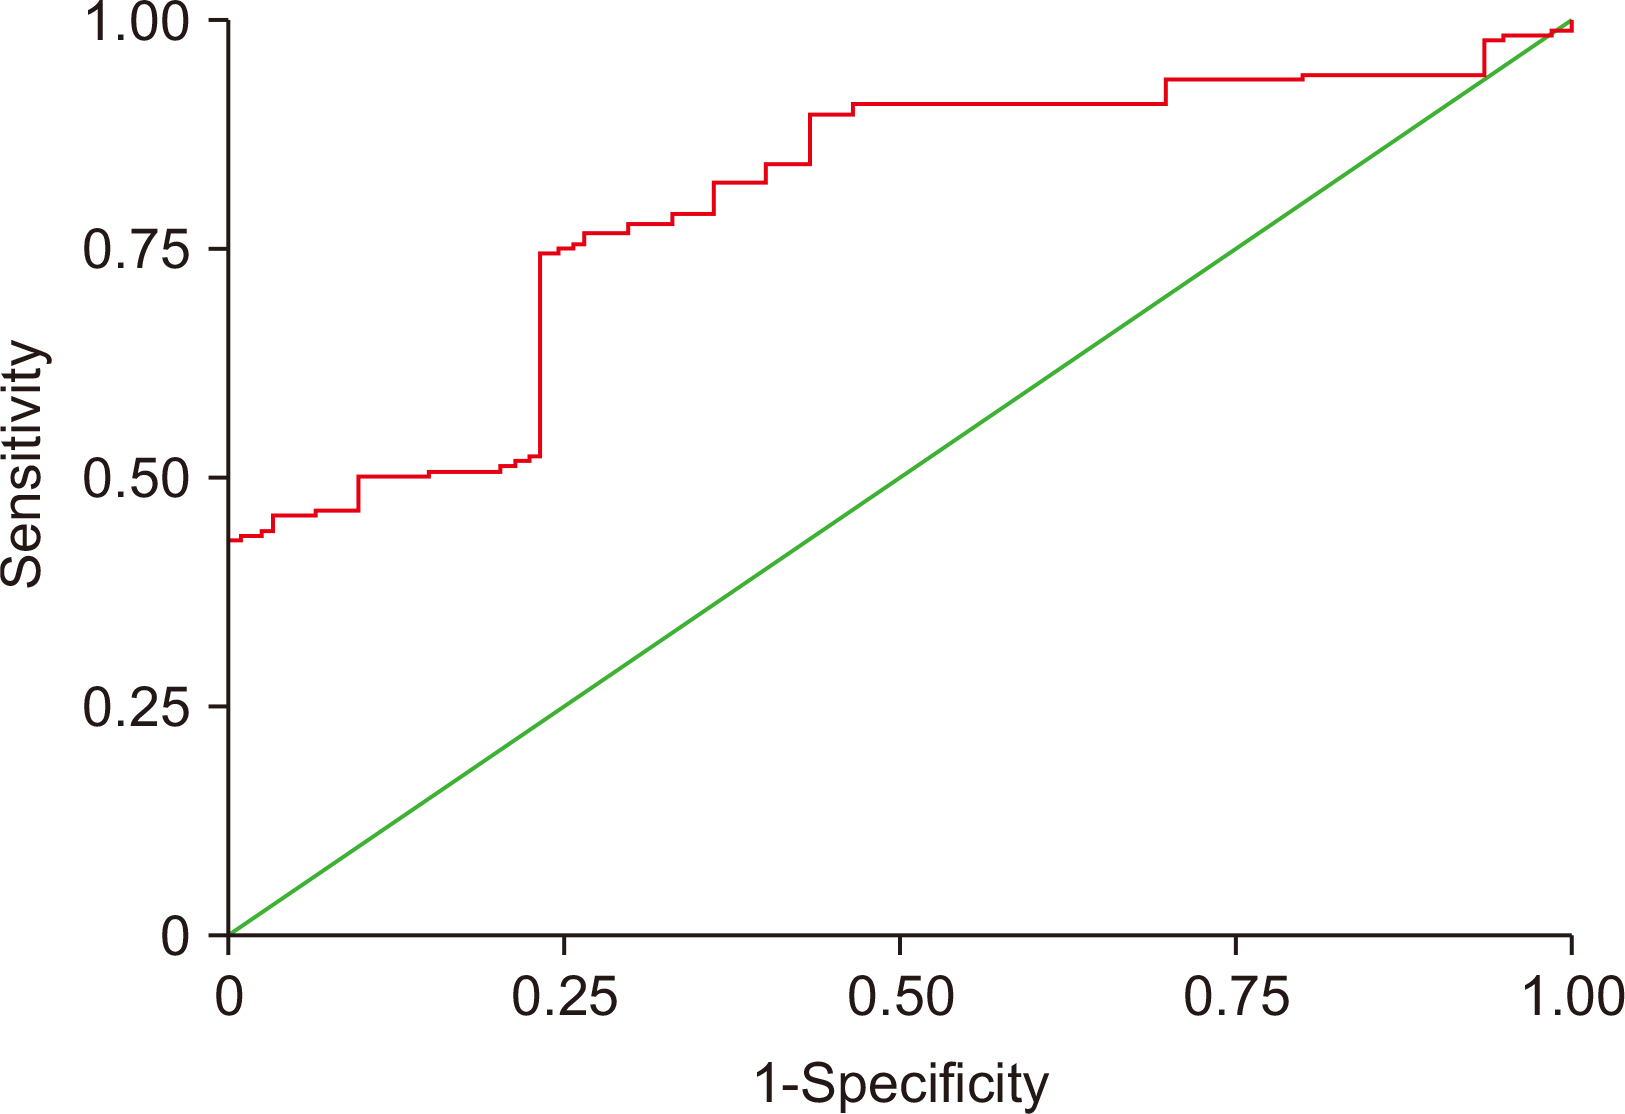
Comparative values of biomarkers for metabolic syndrome calculated using receiver operating characteristic curve analysis
| AUC | SE | 95% CI | Cutoffvalue | Sensitivity (%) | Specificity (%) | |
|---|---|---|---|---|---|---|
| PON-1 | 0.85 | 0.0346 | 0.782–0.915 | <196 | 76 | 83 |
| ARE | 0.70 | 0.0601 | 0.610–0.781 | <346 | 93 | 43 |
| GGT | 0.83 | 0.0381 | 0.756–0.896 | >19 | 73 | 87 |
| ARG | 0.79 | 0.0436 | 0.716–0.867 | >2.8 | 74 | 77 |
AUC = area under the receiver operating characteristic curve; SE = standard error; 95% CI = 95% confidence interval; PON-1 = paraoxonase; ARE = arylesterase; GGT, gamma-glutamyl transferase; ARG = arginase.
Resulting sensitivity, specificity, and predictive values when multiple markers were used to determine metabolic syndrome
| Sensitivity | Specificity | PPV | NPV | |
|---|---|---|---|---|
| GGT-ARG | 84.4 | 73.3 | 61.1 | 90.5 |
| GGT-PON-1 | 80.0 | 83.3 | 93.5 | 58.1 |
| GGT-ARE | 94.4 | 43.3 | 83.3 | 72.2 |
| PON-1-ARE | 84.4 | 73.3 | 90.5 | 61.1 |
| PON-1-ARG | 92.2 | 66.7 | 89.2 | 74.1 |
| ARE-ARG | 100.0 | 30.0 | 81.1 | 100.0 |
PPV = positive predictive value; NPV = negative predictive value; GGT = gamma-glutamyl transferase; ARG = arginase; PON-1 = paraoxonase; ARE = arylesterase.
Values are presented as mean±standard deviation or number (%). MetS = metabolic syndrome; DM = diabetes mellitus; CVD = cardiovascular disease; SBP = systolic blood pressure; DBP = diastolic blood pressure; TC = total cholesterol; LDL = low-density lipoprotein; HDL = high-density lipoprotein; TG = triglyceride; AST = aspartate aminotransferase; ALT = alanine aminotransferase; GGT = gamma-glutamyl transferase; PON-1 = paraoxonase; ARE = arylesterase; ARG = arginase. aKruskal–Wallis test.
TG = triglyceride; HDL = high-density lipoprotein; FBG = fasting blood glucose; MetS = metabolic syndrome; PON-1 = paraoxonase; ARE = arylesterase; ARG = arginase; GGT = gamma-glutamyl transferase. *P<0.05, **P<0.001.
OR = odds ratio; 95% CI = 95% confidence interval; BMI = body mass index; SBP = systolic blood pressure; DBP = diastolic blood pressure; TC = total cholesterol; LDL = low-density lipoprotein; HDL = high-density lipoprotein; TG = triglyceride; AST = aspartate aminotransferase; ALT = alanine aminotransferase; GGT = gamma-glutamyl transferase; PON-1 = paraoxonase; ARE = arylesterase; ARG = arginase. aAge- and gender-adjusted OR and 95% CI values.
AUC = area under the receiver operating characteristic curve; SE = standard error; 95% CI = 95% confidence interval; PON-1 = paraoxonase; ARE = arylesterase; GGT, gamma-glutamyl transferase; ARG = arginase.
PPV = positive predictive value; NPV = negative predictive value; GGT = gamma-glutamyl transferase; ARG = arginase; PON-1 = paraoxonase; ARE = arylesterase.

 E-submission
 KSPEN
KSPEN KSSMN
KSSMN ASSMN
ASSMN JSSMN
JSSMN


 Cite
Cite

